Data reports · Flagship publications

Bring us the data. Leave with the report.

Survey rounds, spreadsheets, ESG disclosures: we turn them into a flagship report your board, funders and press will read. Send us the brief and we’ll come back within a week with a page plan, a chart system and a timeline.

Our flagship service

A flagship report carries a year of research, thousands of numbers and an organisation’s name. We make every one of those numbers count: checked against its source, given the form its finding needs, set on a page people want to read.

  • Built for heavy data

    Dozens of charts, one visual system. We design the system first, so the thirty-eighth figure reads as easily as the first.

  • Bespoke, chart by chart

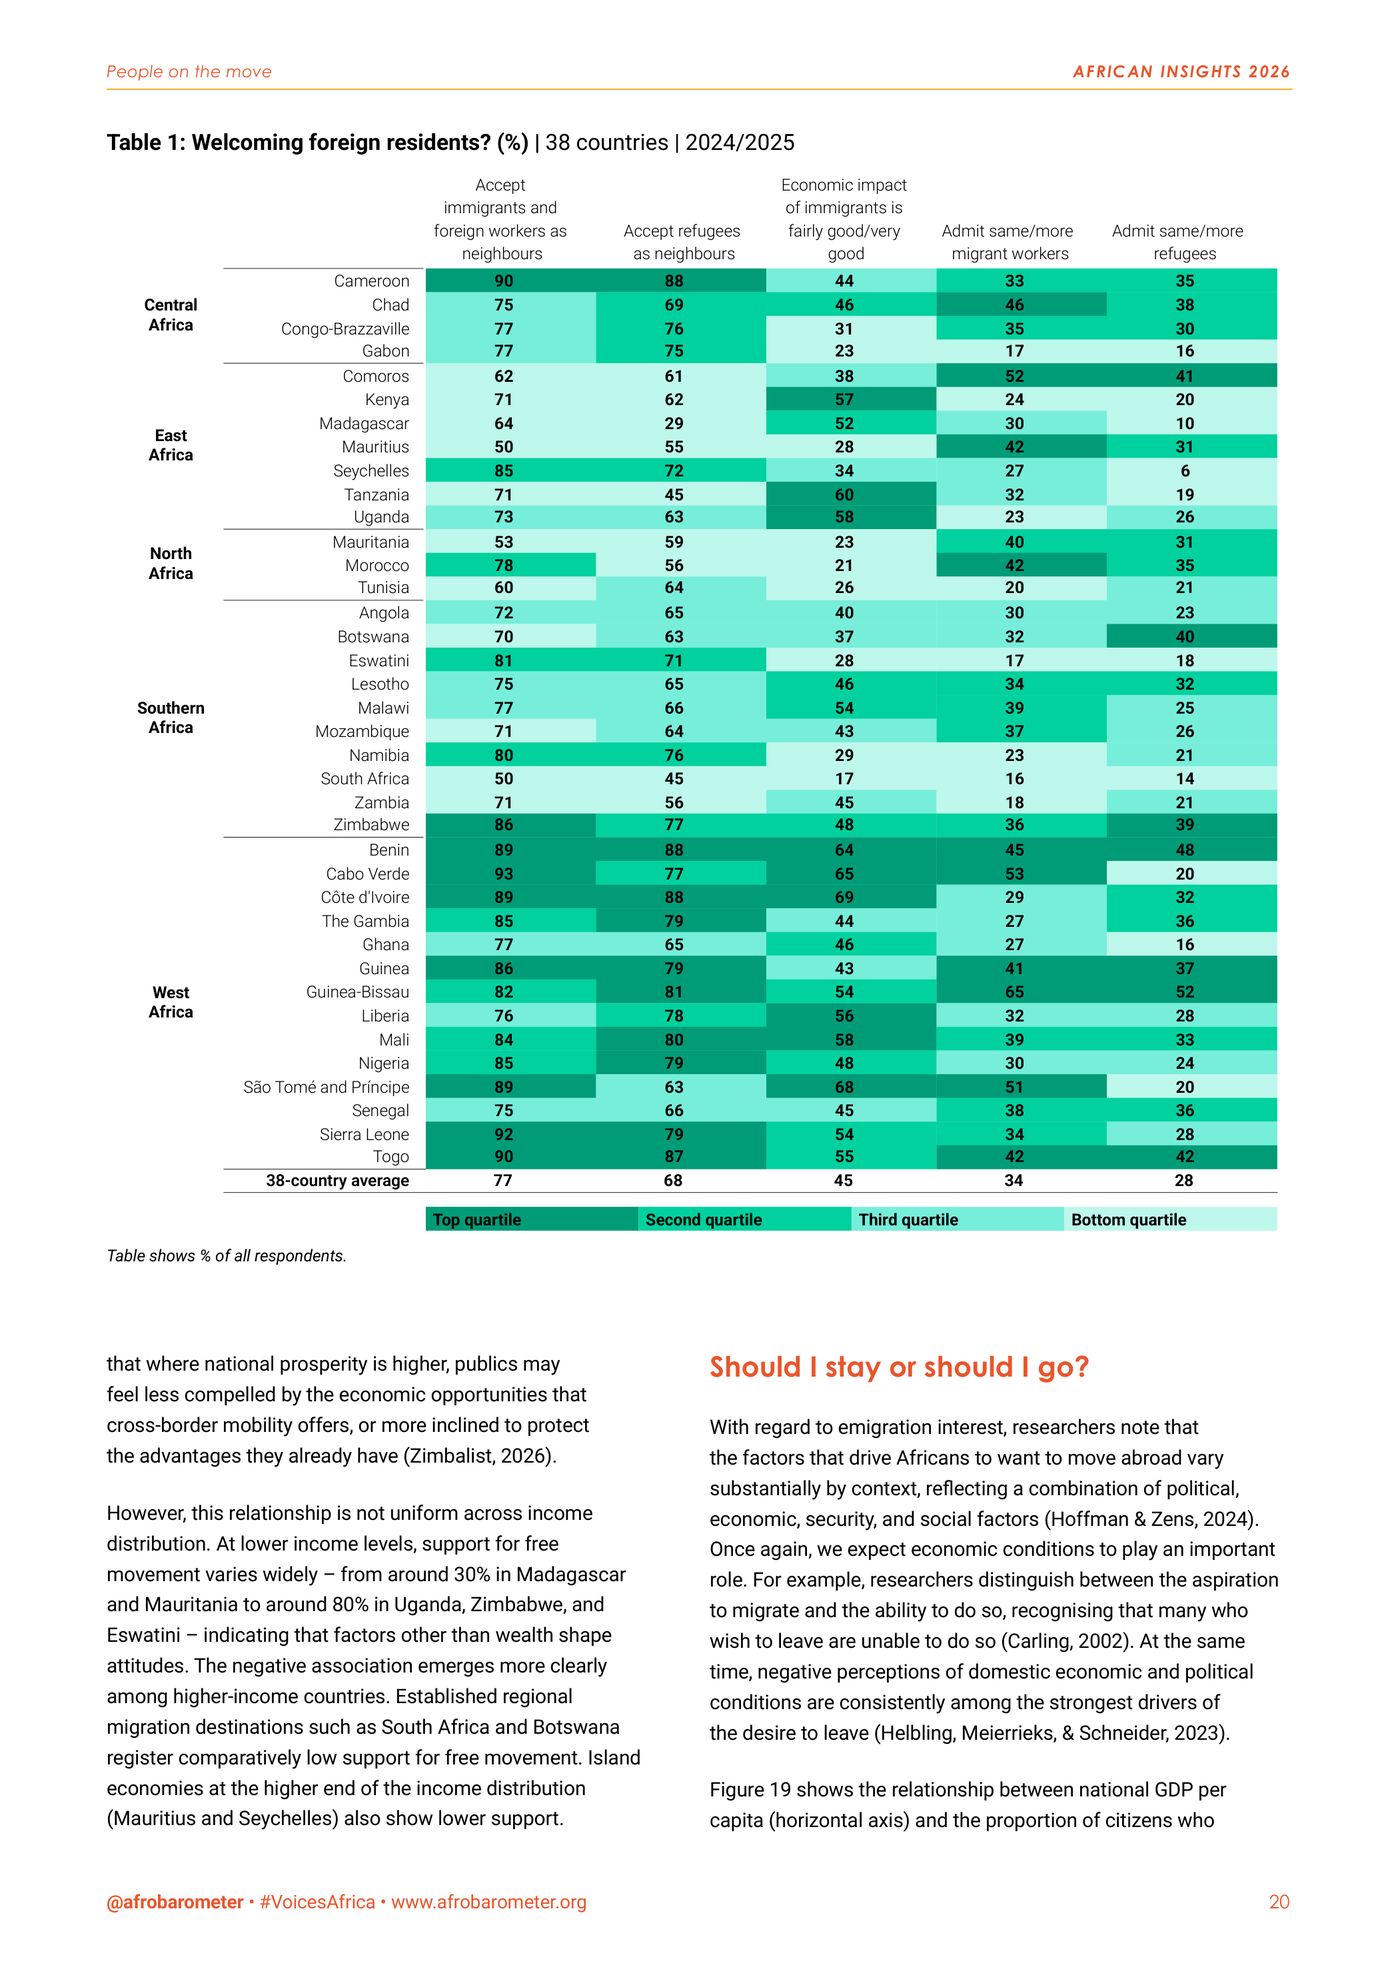
    No templates. Flows become a Sankey, 38 countries become a heatmap, and sometimes the right chart is a single number.

  • Checked before it’s drawn

    Every figure is traced back to its dataset before it reaches the page, and checked again on the proof.

Case studies

Our flagship reports.

One pan-African survey, one corporate sustainability report. Both dense with data, both designed from the first page to the last.

Afrobarometer

Beyond borders

African insights 2026. Citizen perspectives on a shifting global order.

Afrobarometer’s flagship report for 2026 asks how Africans see a world in flux: free trade under the AfCFTA, migration, the great powers, the continent’s voice in global institutions and climate action. Survey data from 38 countries, carried by 38 figures and 4 tables in a single chart system, from a 38-country heatmap to one-page country scorecards.

Colophon, p. 2: Report design by nutgraf.studio

Pages
48in English
Figures
38plus 4 tables
Countries
38Round 10 survey, 2024/2025
Data
Face-to-face interviews, nationally representative samples
Our role
Report design: editorial and chart design
Client
Afrobarometer, pan-African research network
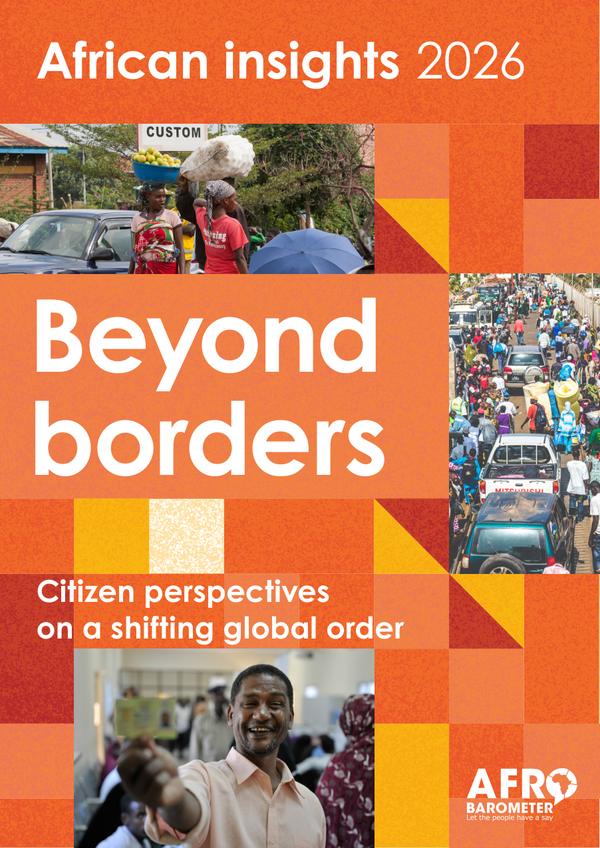
Cover of Beyond borders, African insights 2026: orange and red tiles framing photos of a border crossing, a crowded street and a man holding up an ID card.
The cover
Inside · 8 of 48 pages
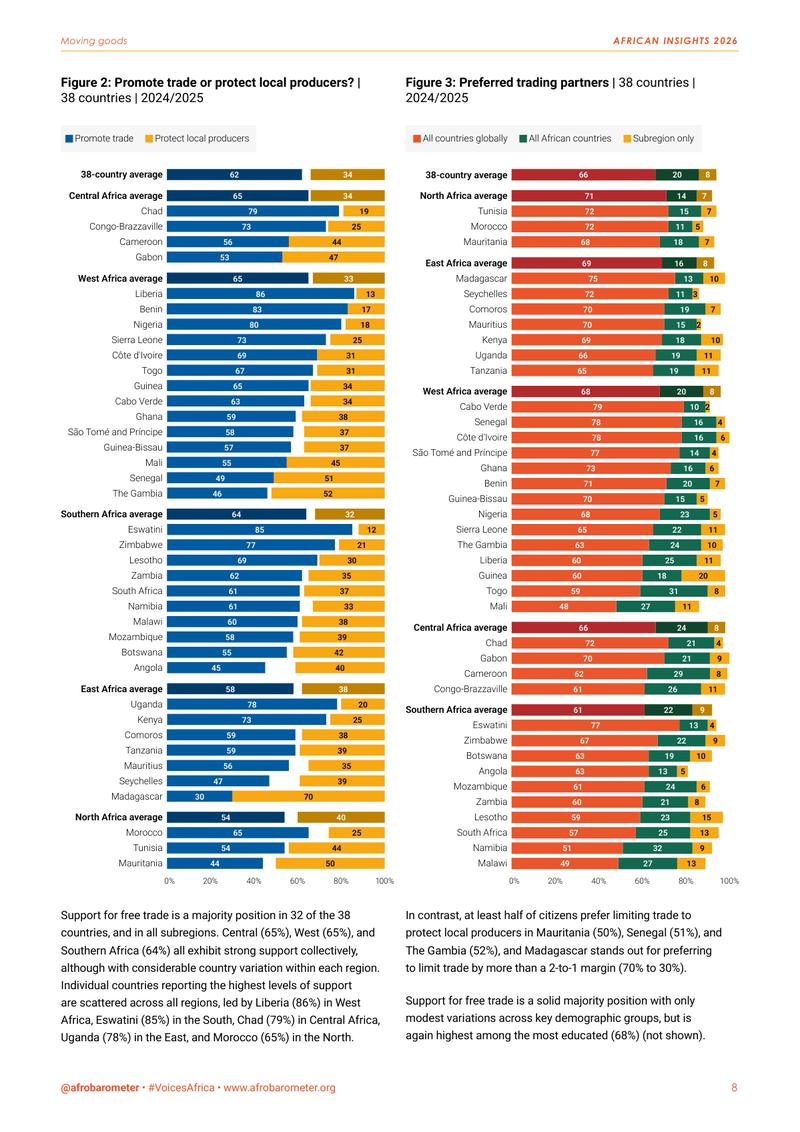
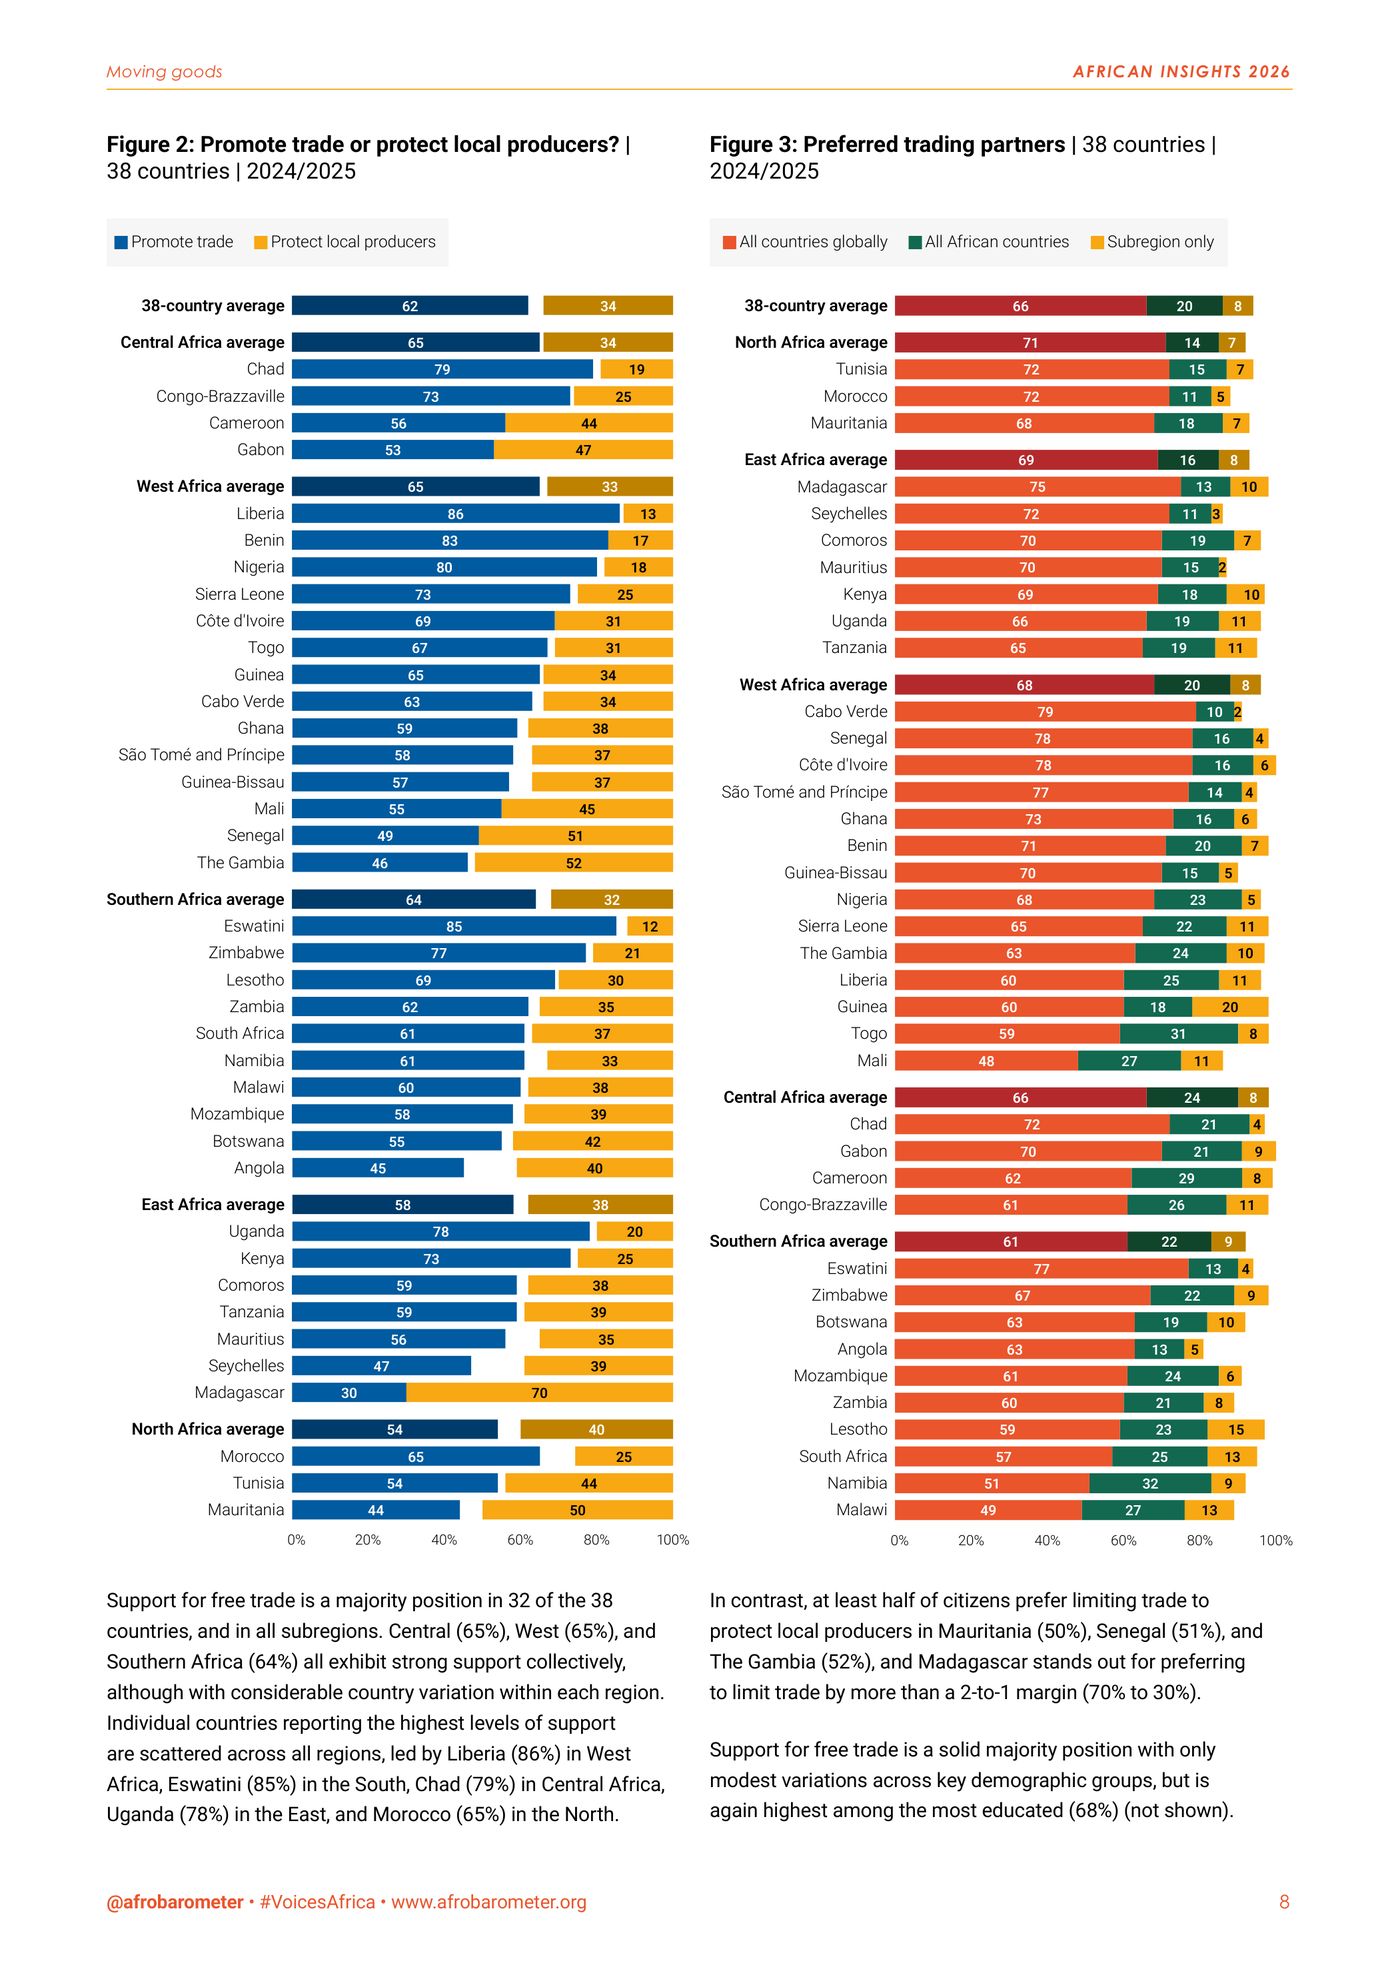
  • Page 8: two long stacked bar charts ranking 38 countries on free trade versus protection and on preferred trading partners.
    p. 8Free trade or protection?
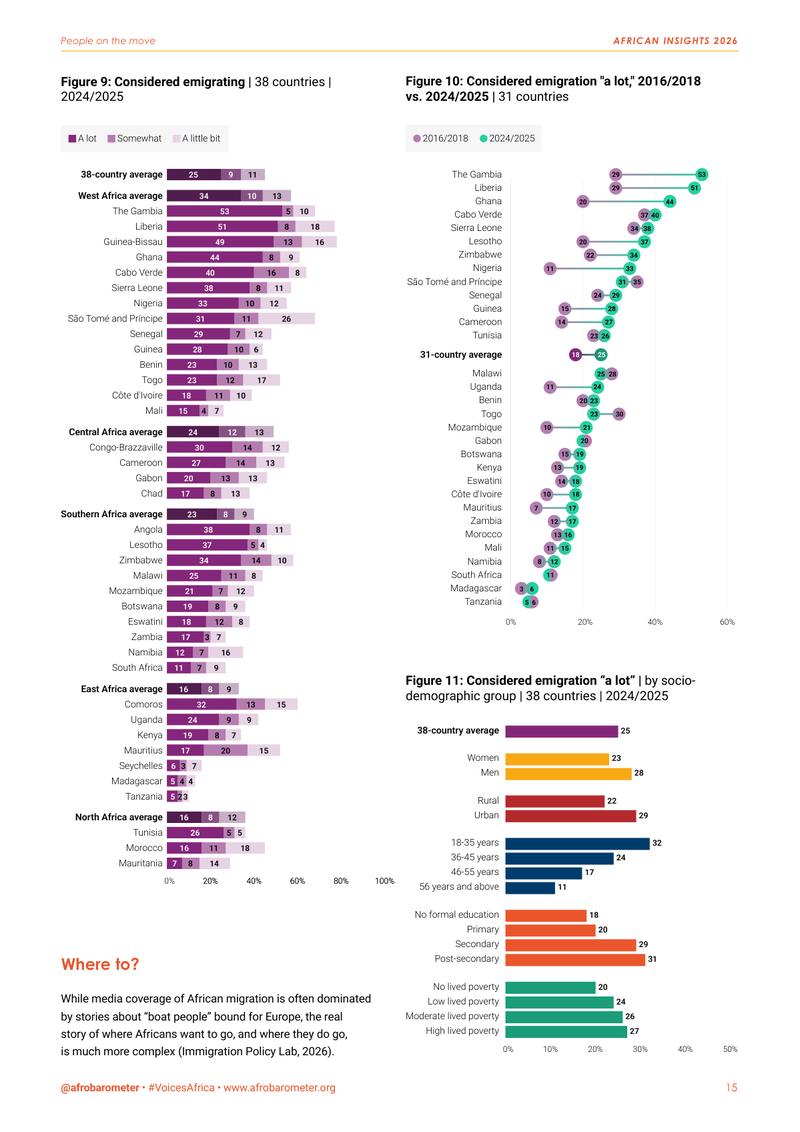
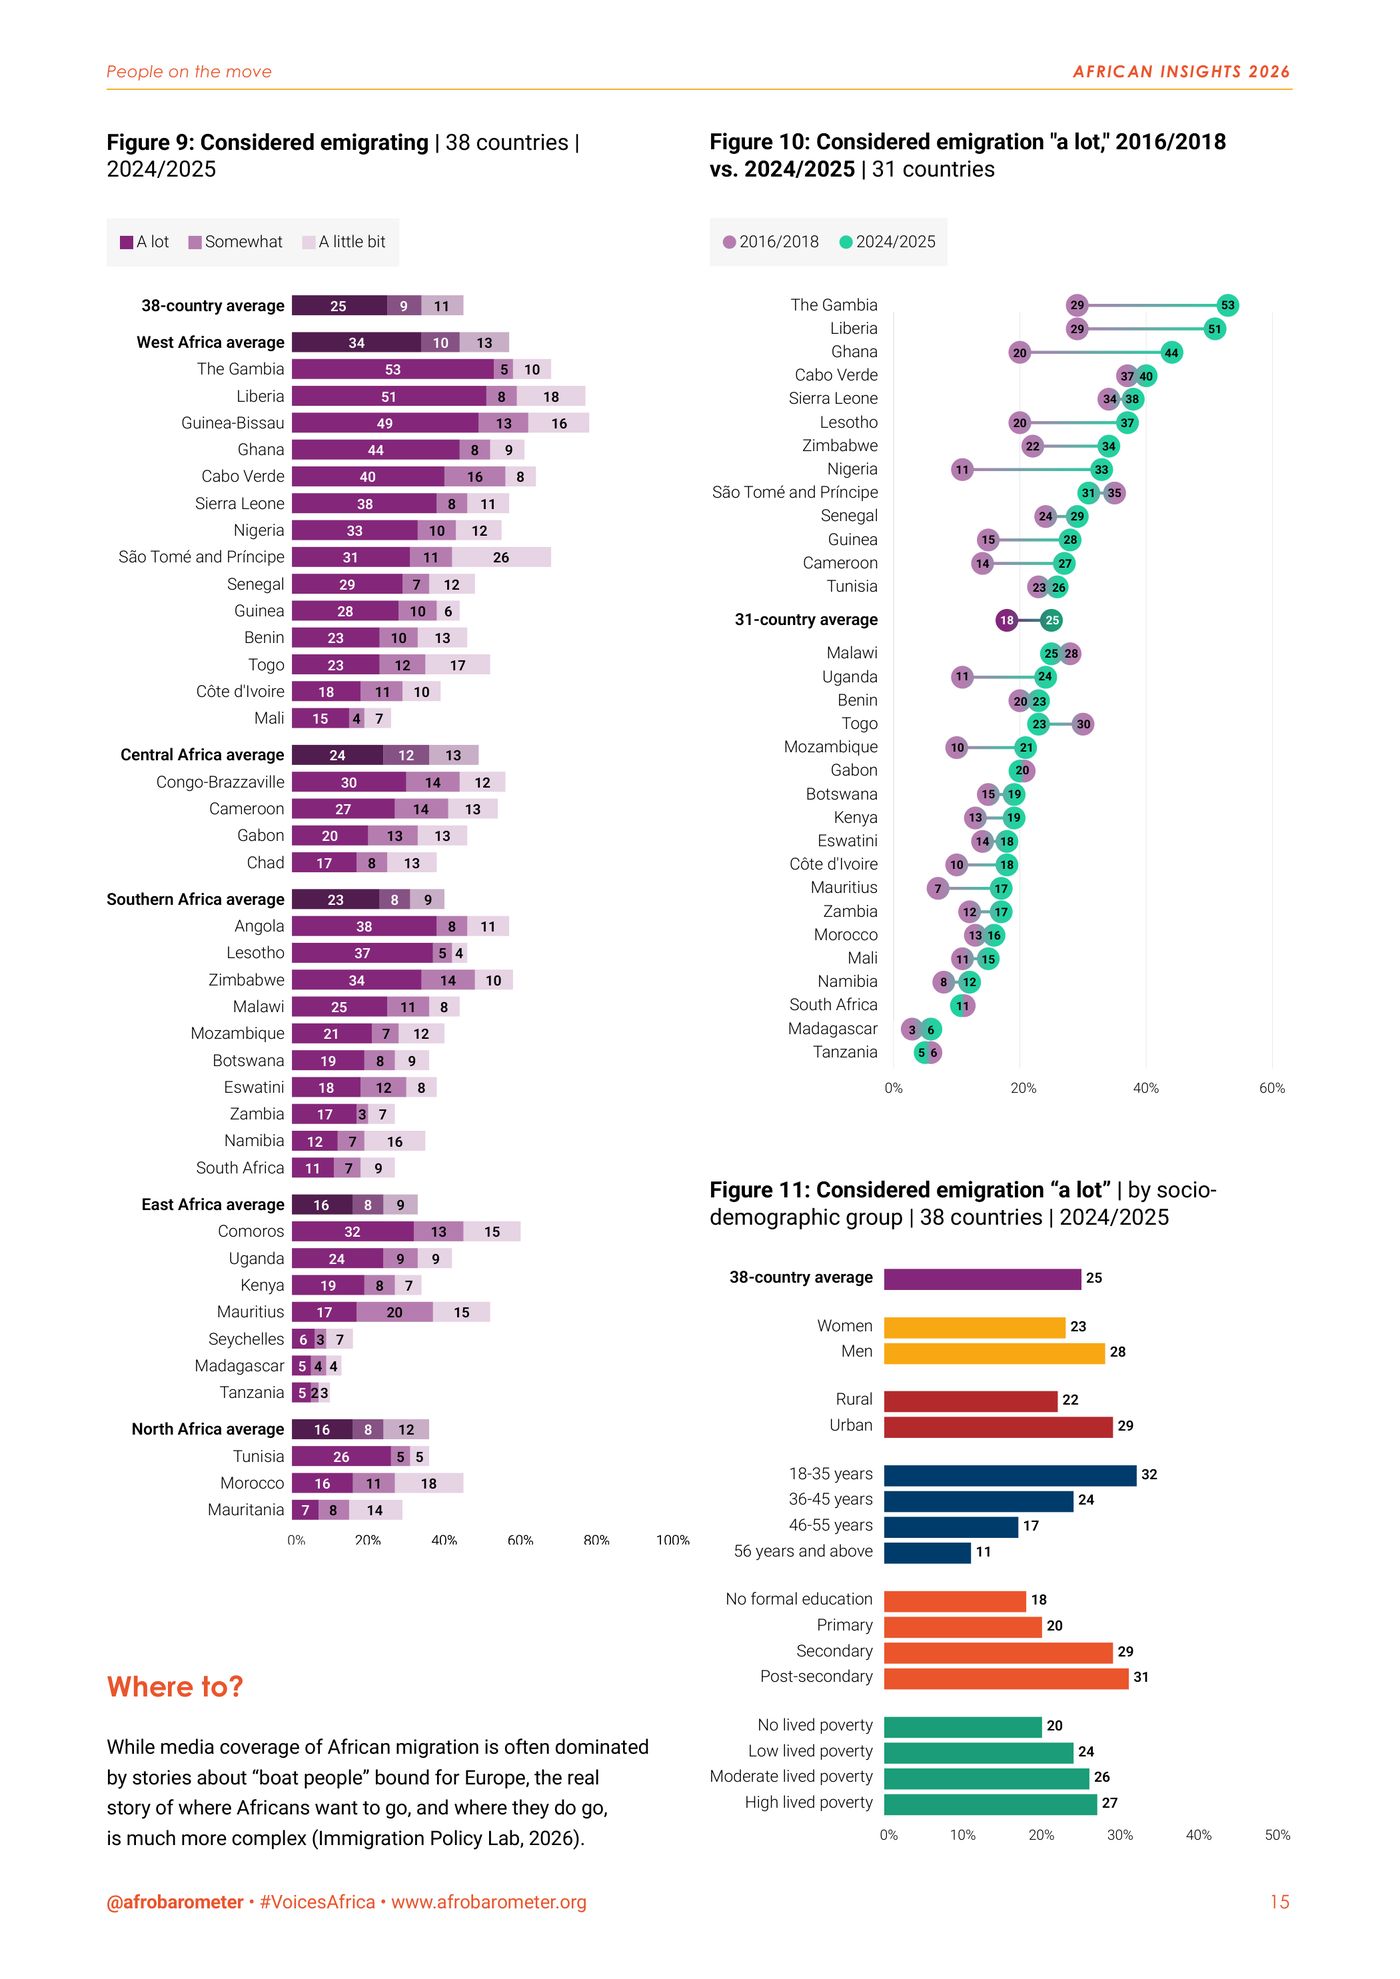
  • Page 15: purple stacked bars of emigration intentions by country, a dot plot comparing two survey rounds and bars by demographic group.
    p. 15Who is thinking of leaving
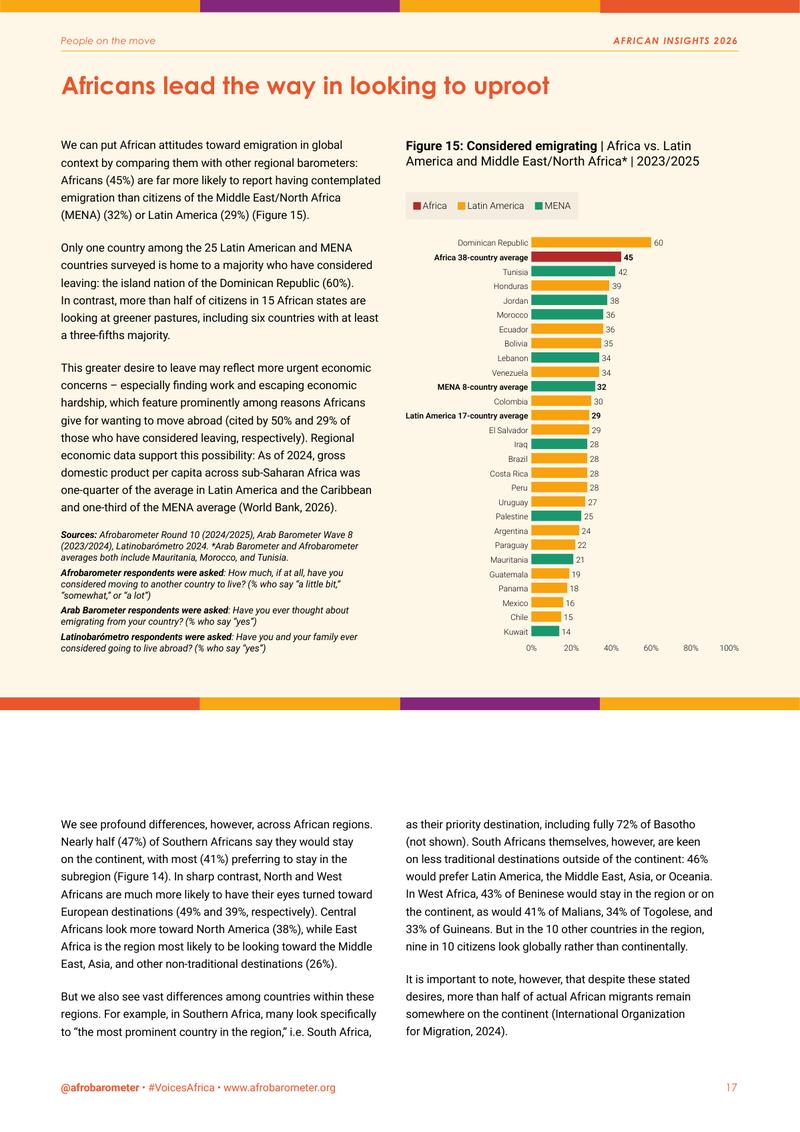
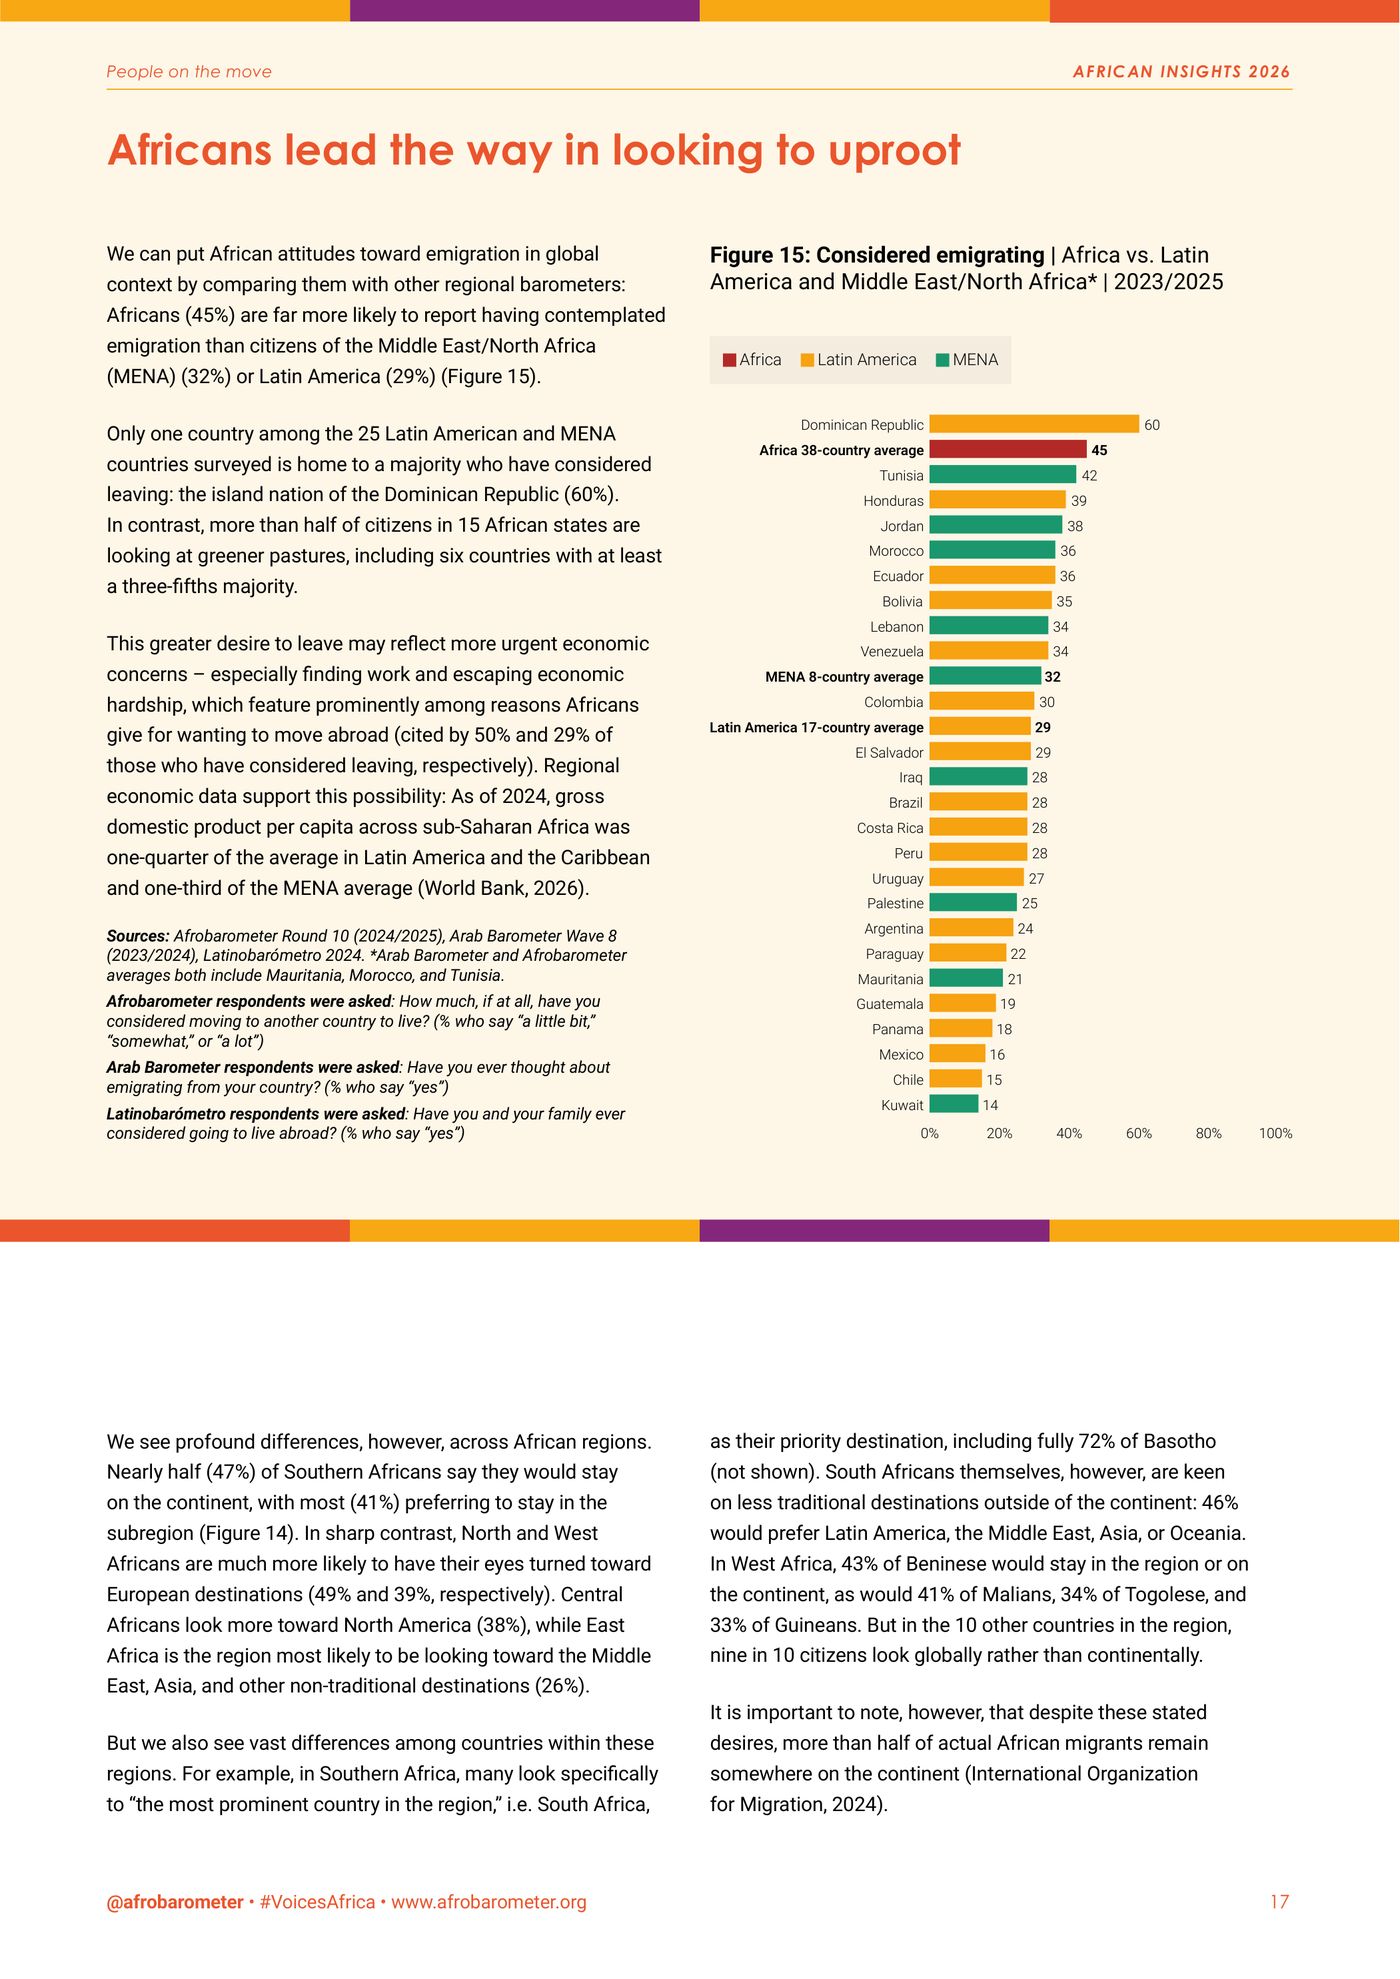
  • Page 17: a cream panel with a bar chart comparing emigration intentions in Africa, Latin America and the Middle East and North Africa.
    p. 17Africa against two other regions
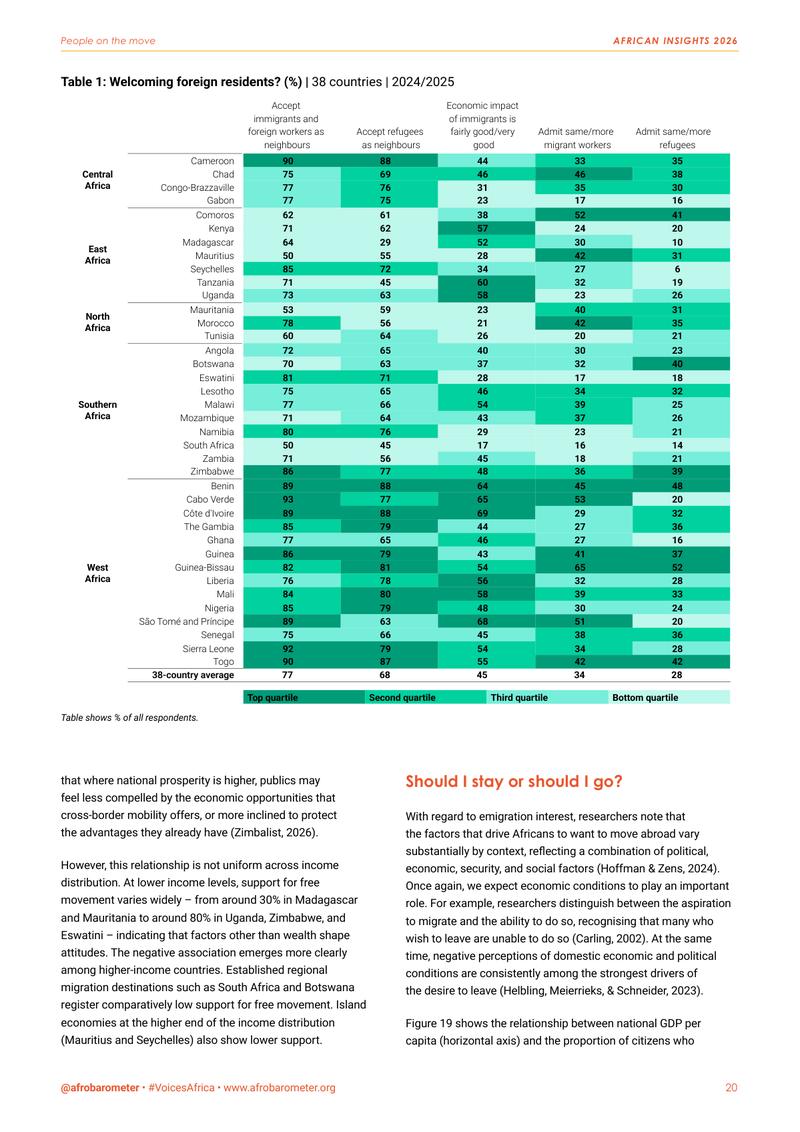
  • Page 20: a green heatmap table of attitudes towards immigrants and refugees in 38 countries, grouped by region.
    p. 20A 38-country heatmap
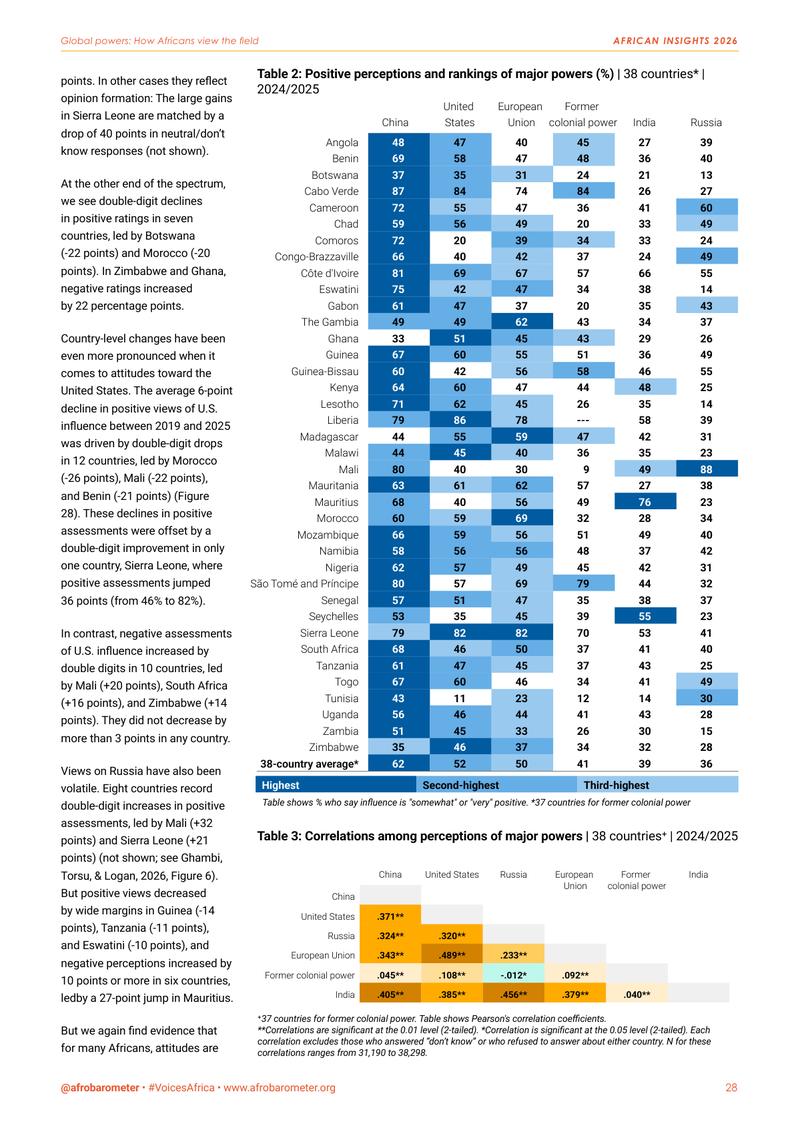
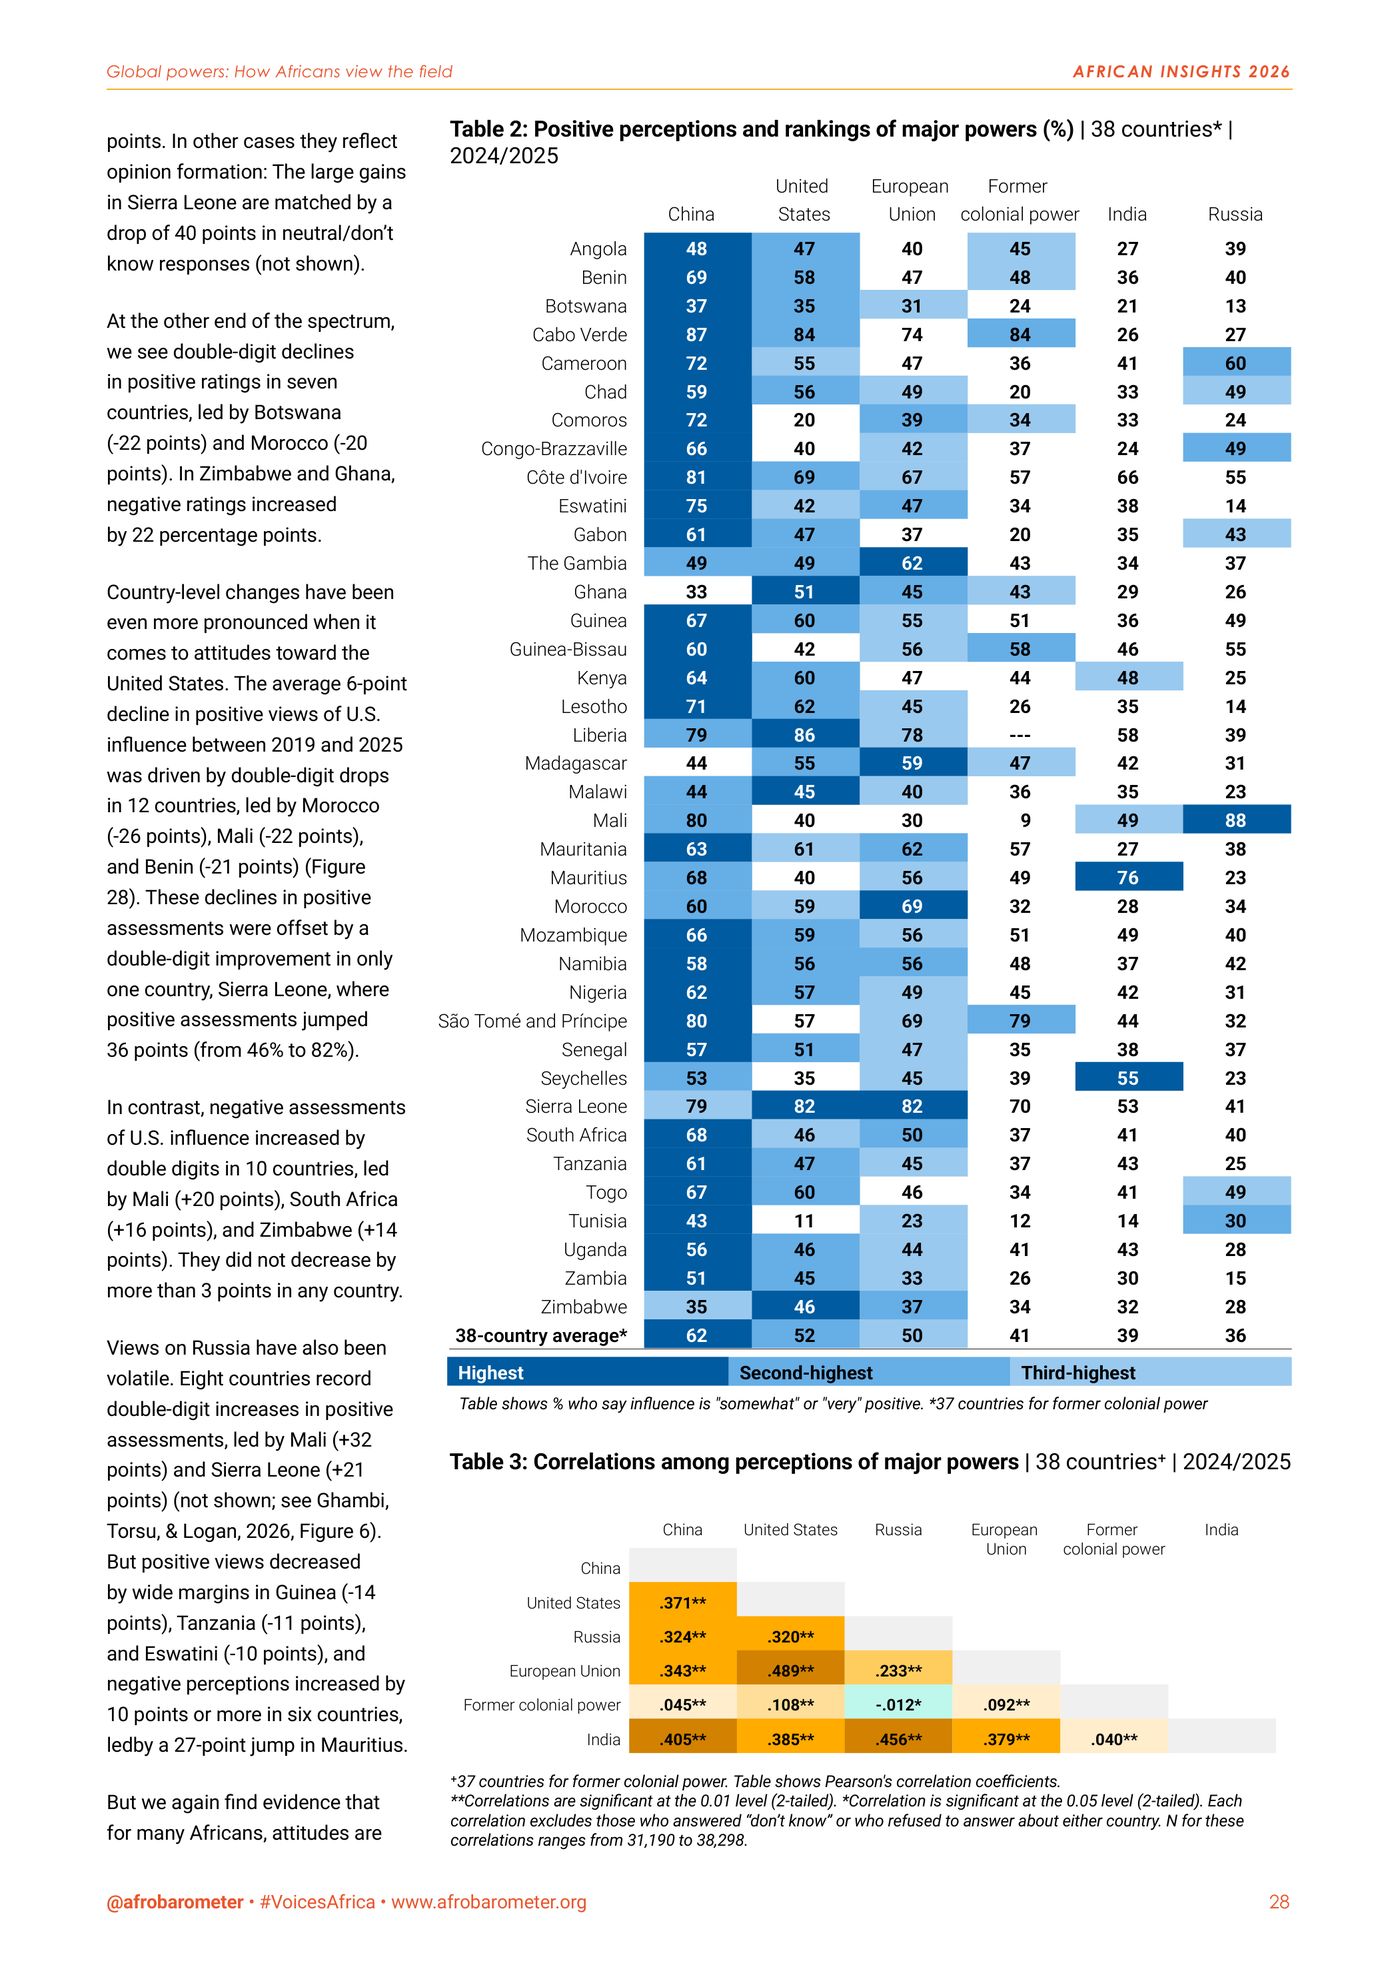
  • Page 28: a blue-shaded table of positive views of China, the United States, the EU, former colonial powers, India and Russia in 38 countries.
    p. 28Rating the major powers (rebuilt as a dashboard below)
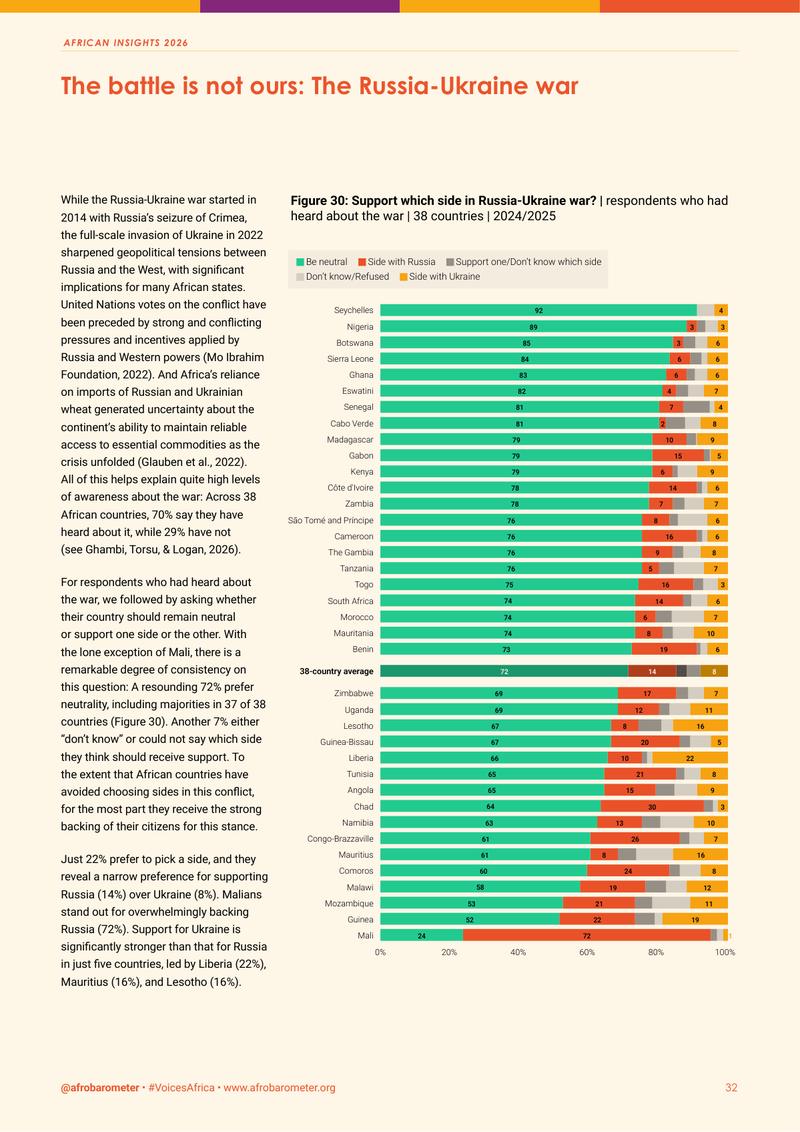
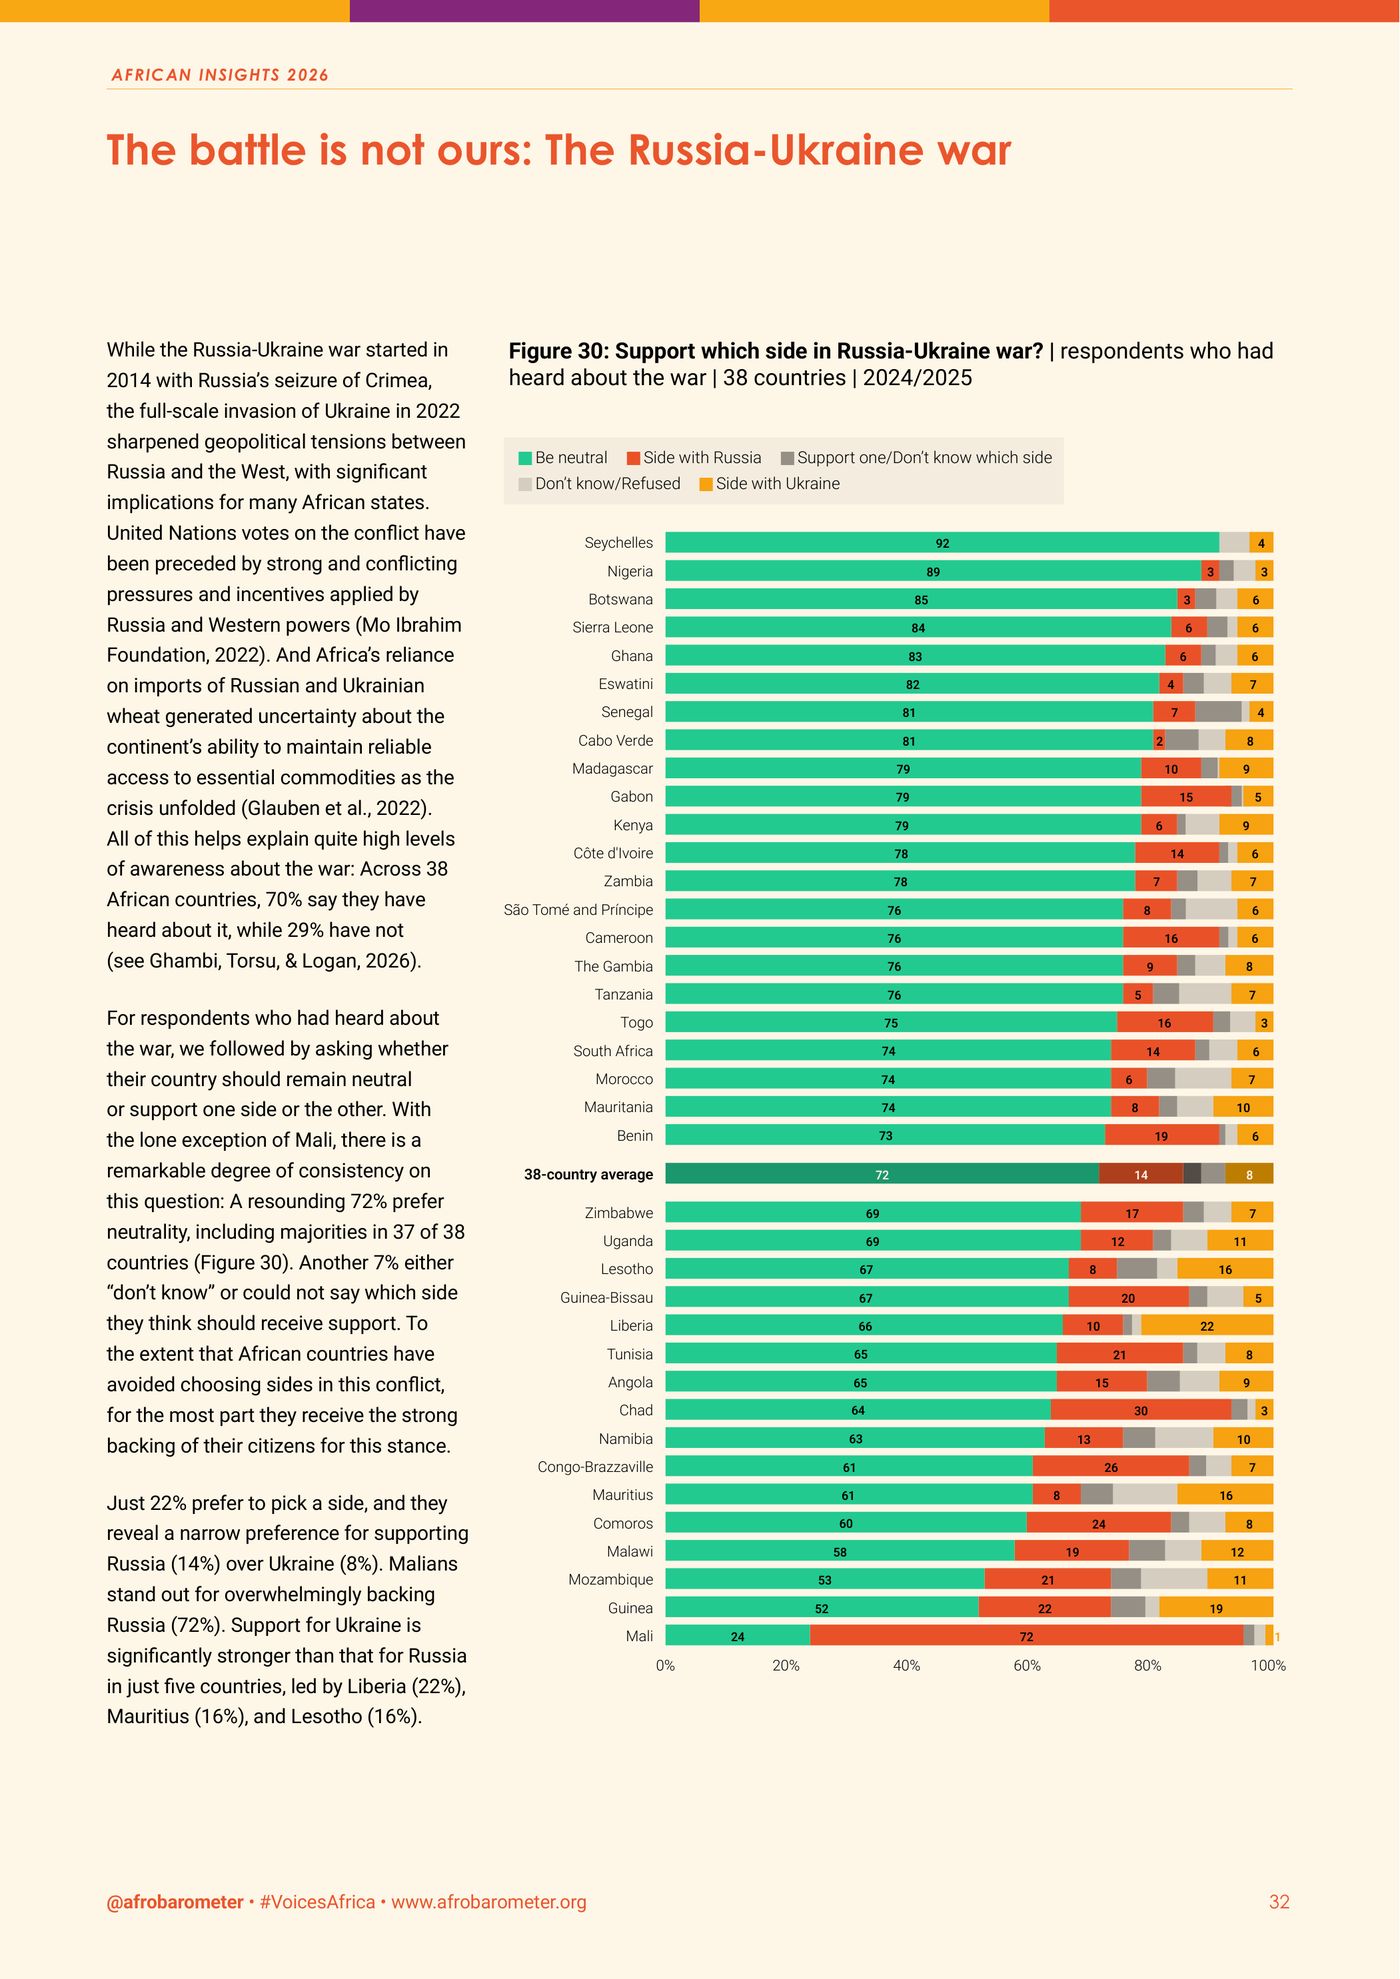
  • Page 32: a cream feature panel on the Russia–Ukraine war with a diverging bar chart by country.
    p. 32The Russia–Ukraine war
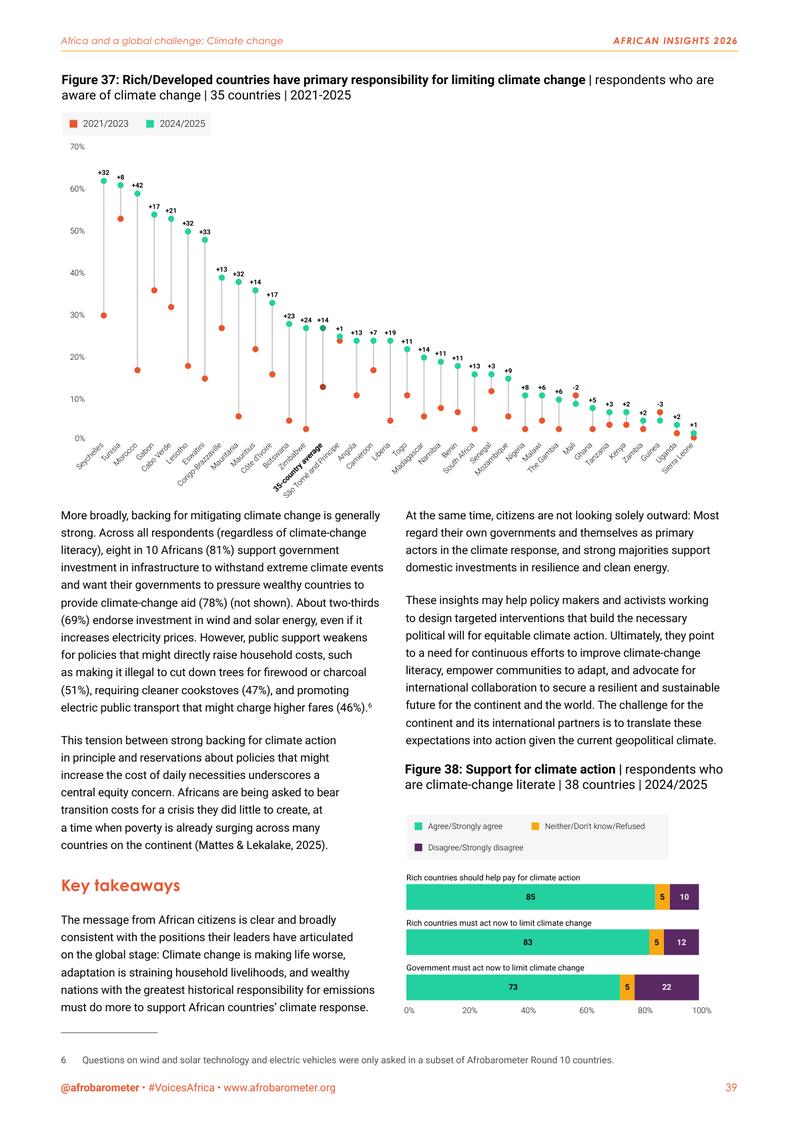
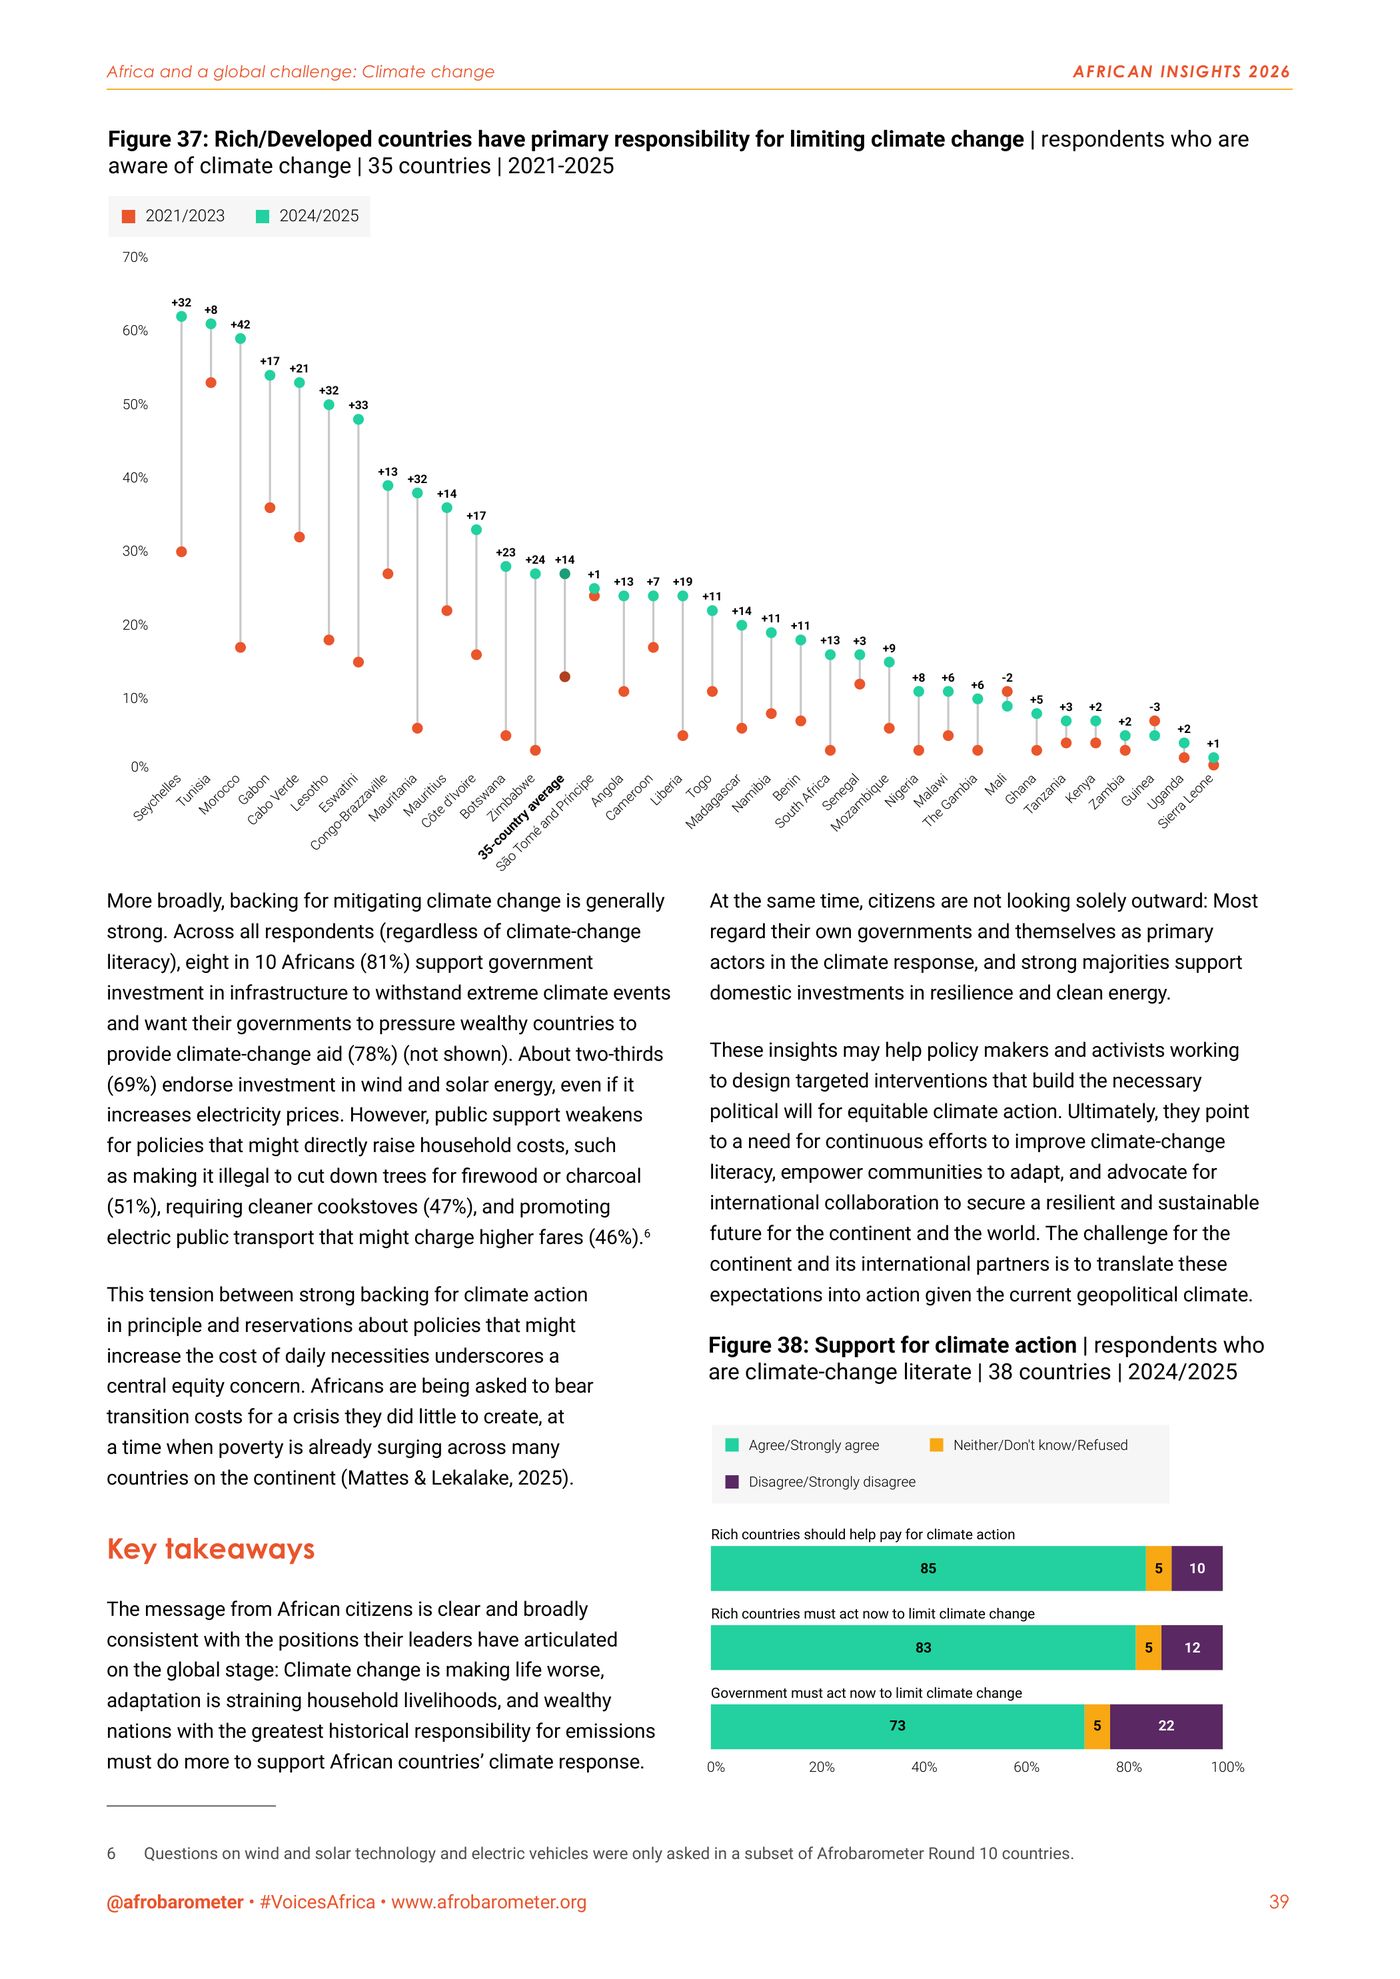
  • Page 39: a dot plot of who should take responsibility for limiting climate change, by country, and stacked bars on support for climate action.
    p. 39Who should act on climate
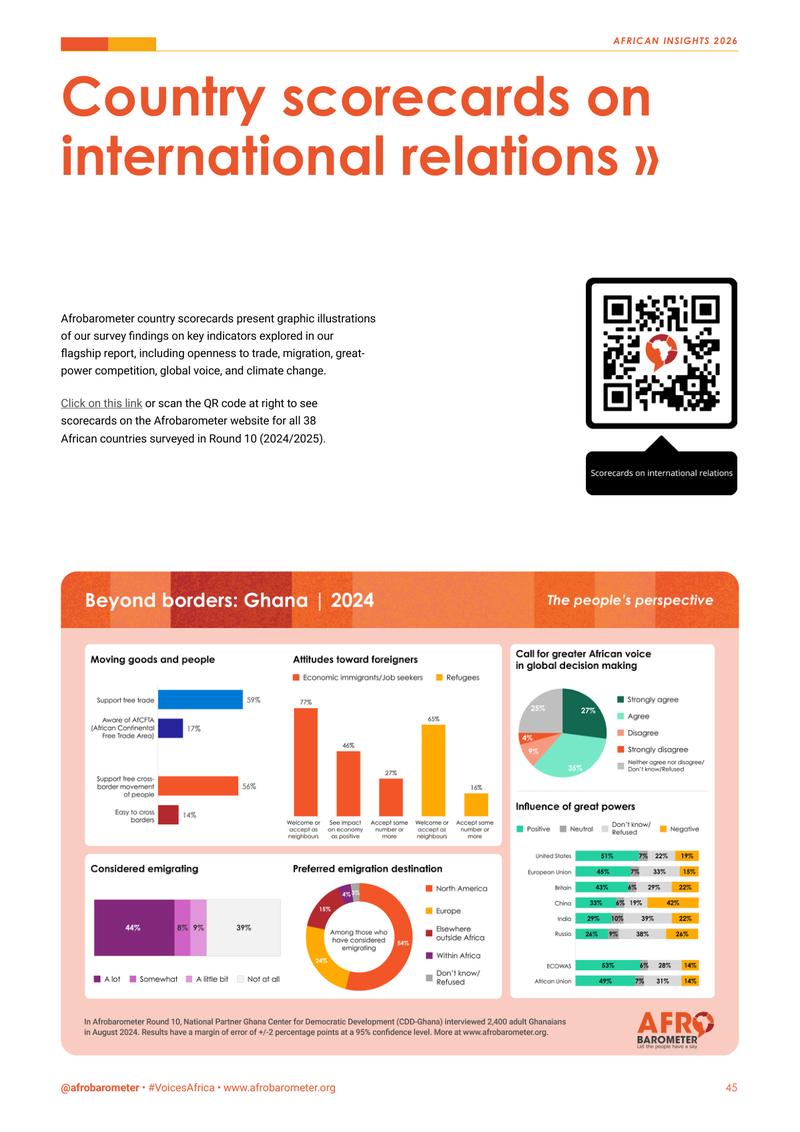
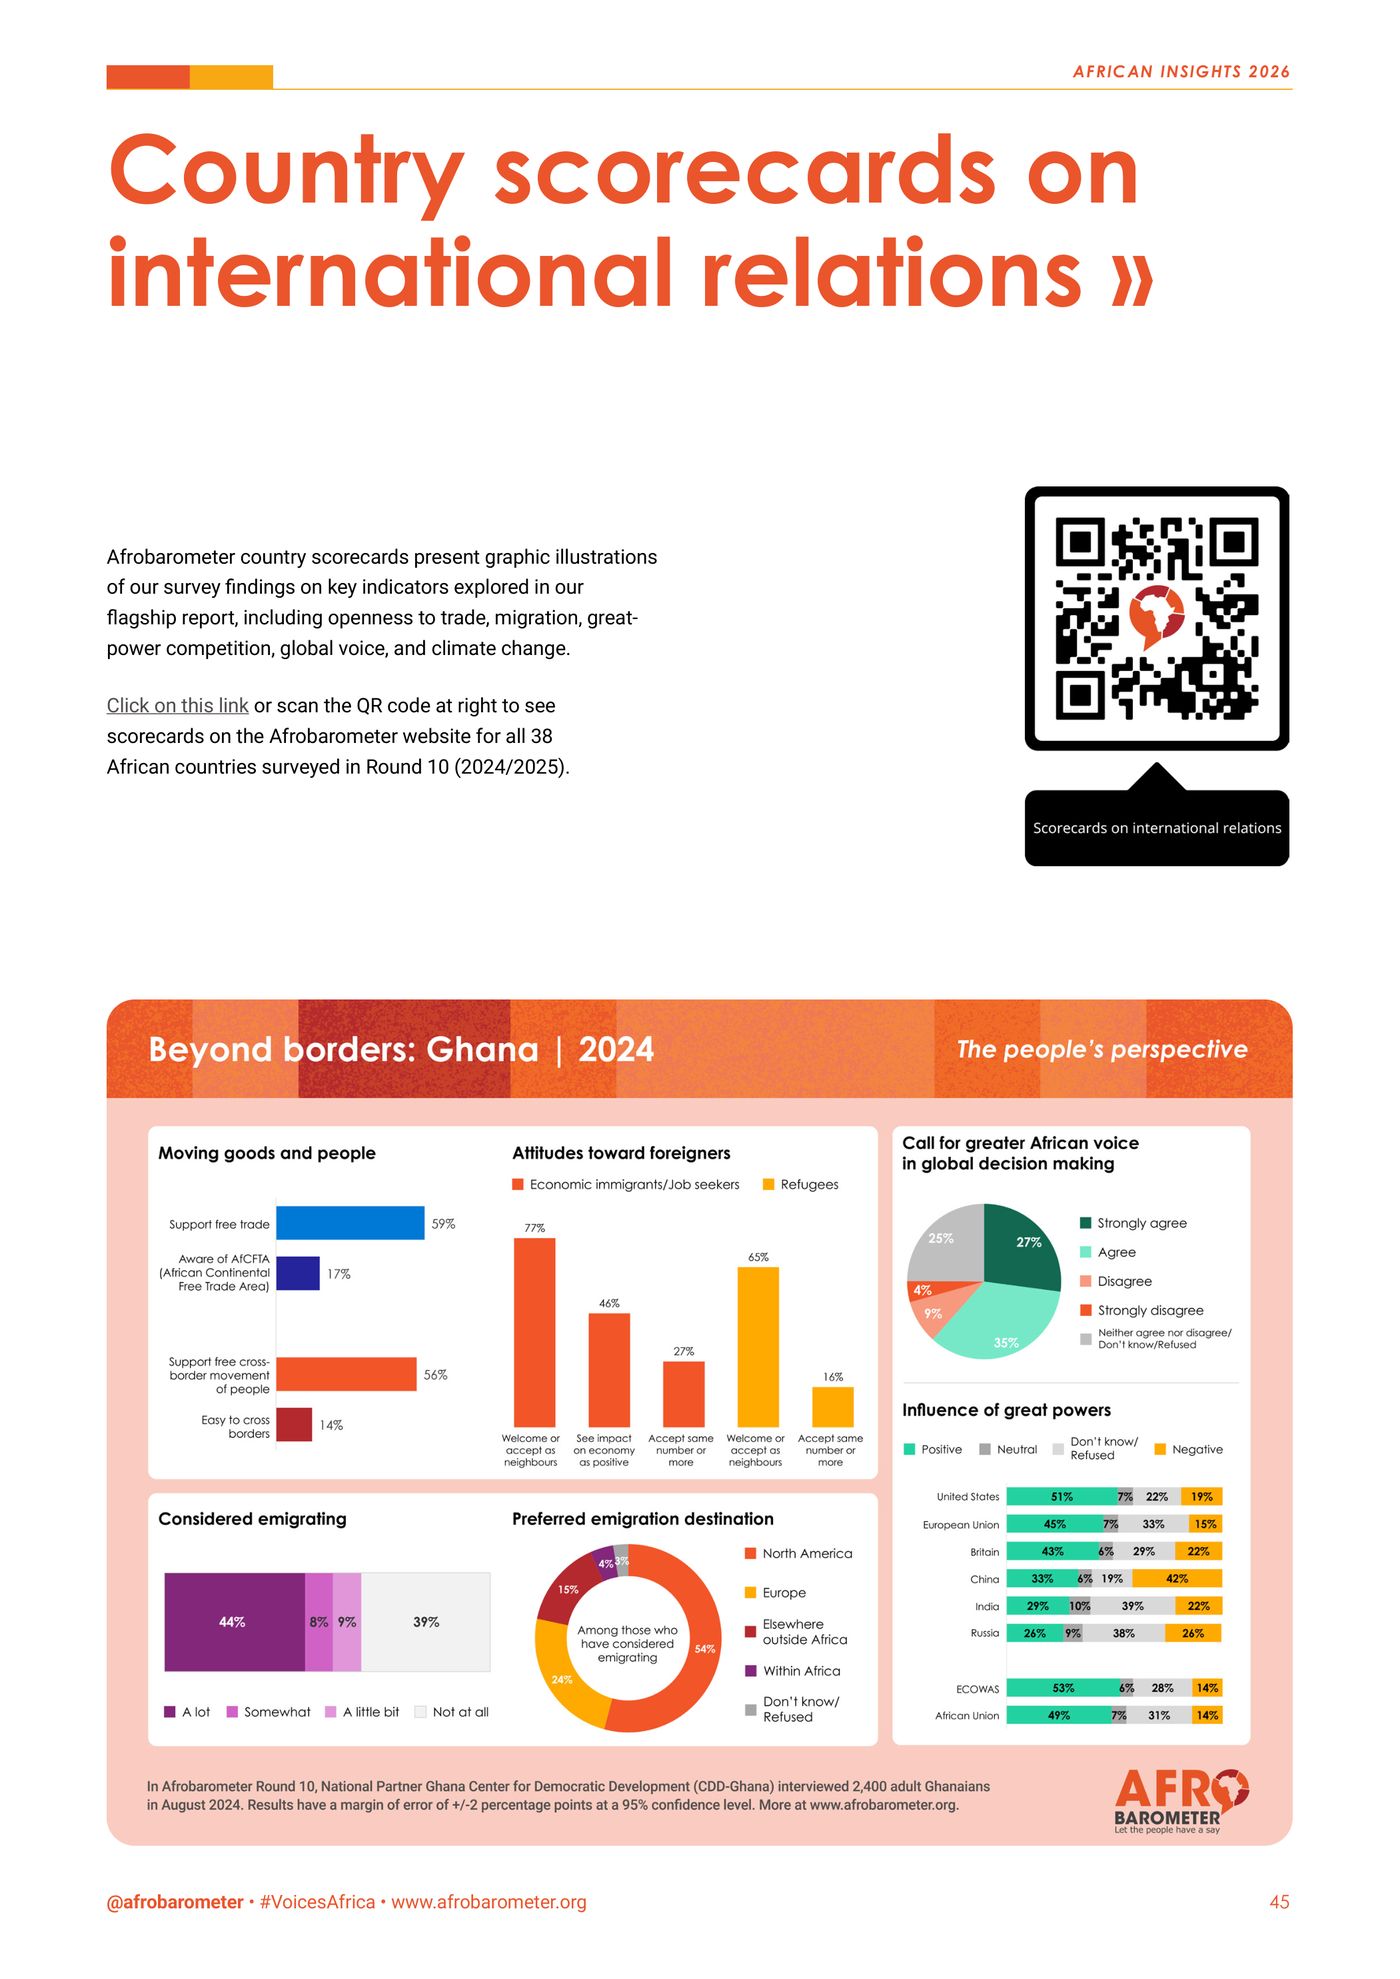
  • Page 45: the country scorecard for Ghana, with bars, a pie and donut charts on trade, migration and great powers.
    p. 45One country on one page

PPC Group Rețele Electrice România
Raport de Sustenabilitate 2024

Sustainability Report 2024. The first Rețele Electrice report prepared with reference to ESRS.

PPC Group’s electricity distributor in Romania, covering Banat, Dobrogea and Muntenia, reports on materiality, governance, climate, its people and the modernisation of its grid, under the EU’s new sustainability reporting standards. We turned 105 pages of ESG disclosure into KPI tiles, flows and rings a non-specialist can read, without losing a decimal.

Pages
105in Romanian
On one page
793,348tCO₂e, traced from 3 scopes to 11 sources
Framework
ESRS, the reporting standards of the EU’s CSRD
Our role
Editorial design and data visualisation
Client
Rețele Electrice România, PPC Group
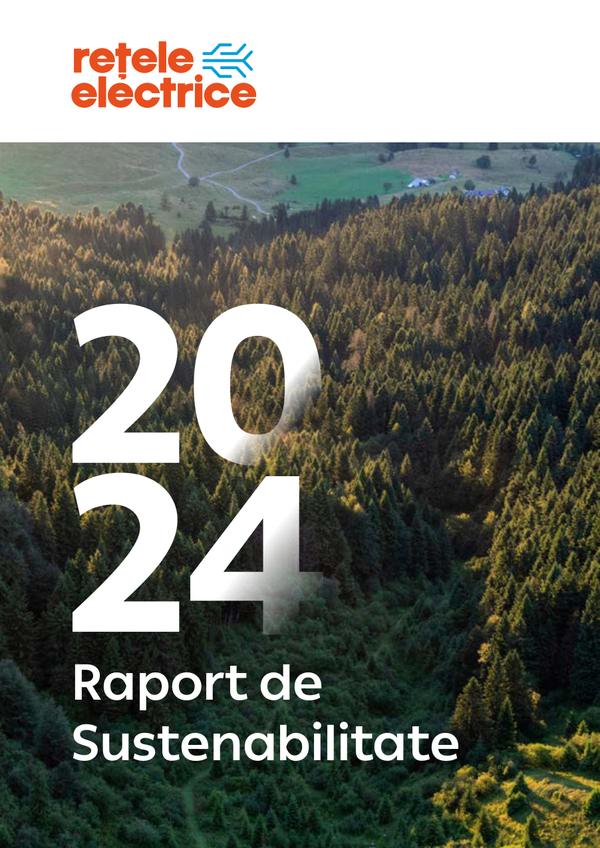
Cover of the Rețele Electrice 2024 sustainability report: a large 2024 over a forested mountain valley.
The cover
Inside · 8 of 105 pages
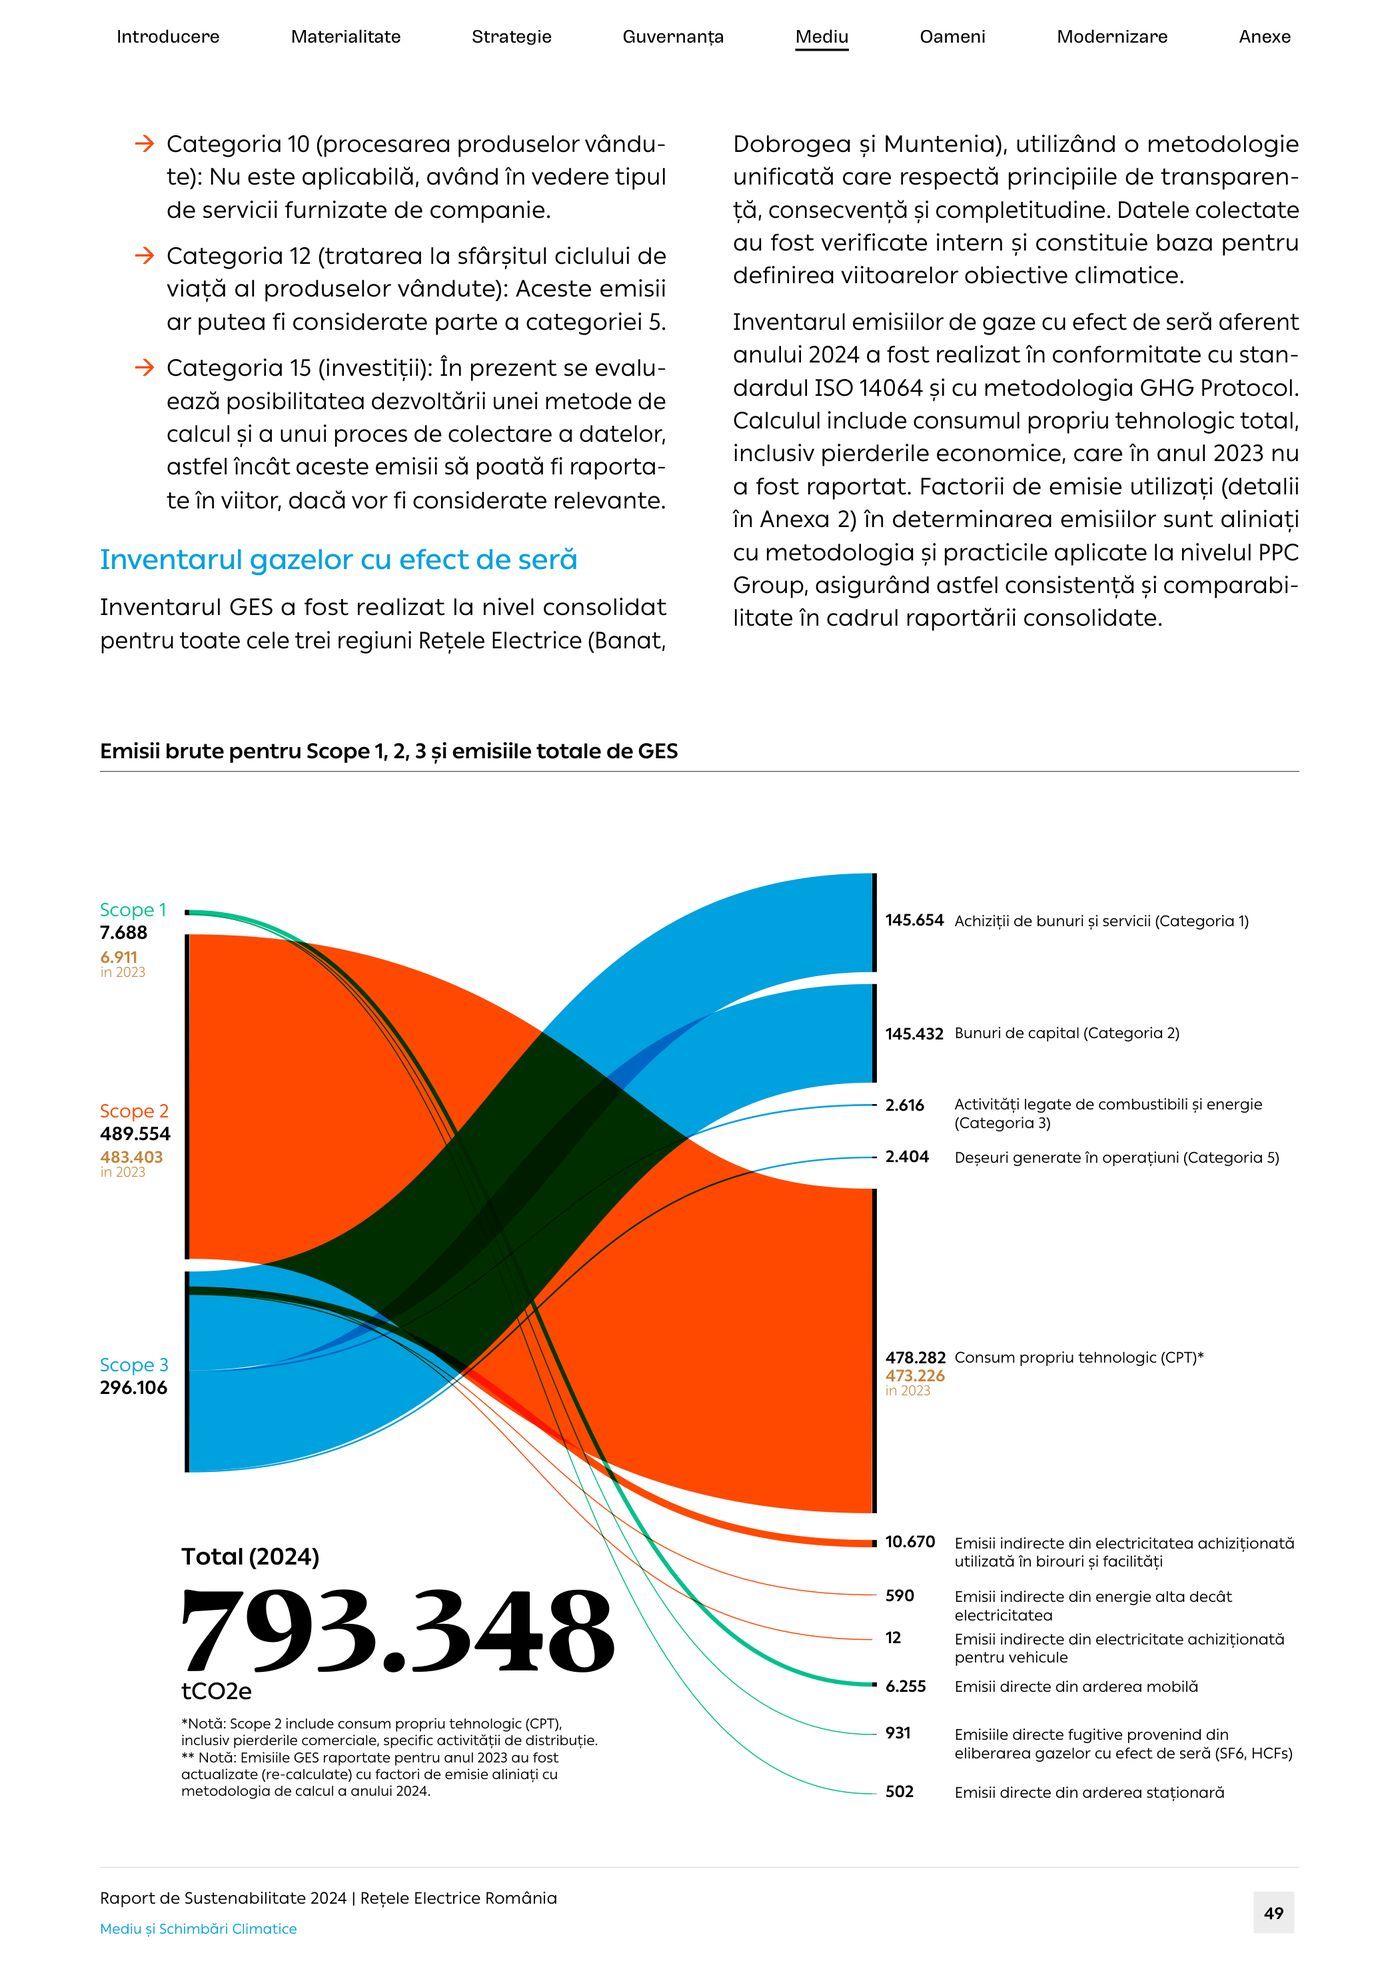
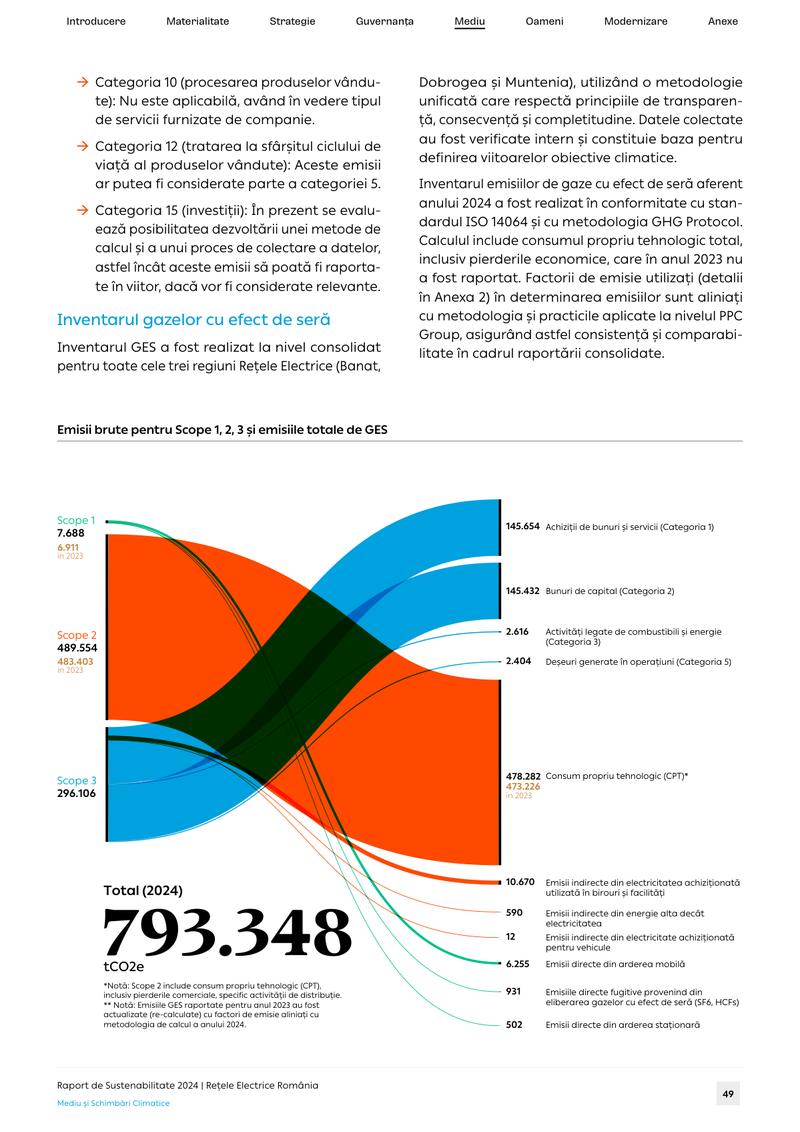
  • Page 49: a Sankey diagram in green, orange and blue tracing 793,348 tonnes of CO₂ equivalent from three emission scopes to eleven sources. Live below ↓
    p. 49Emissions, scope by scope
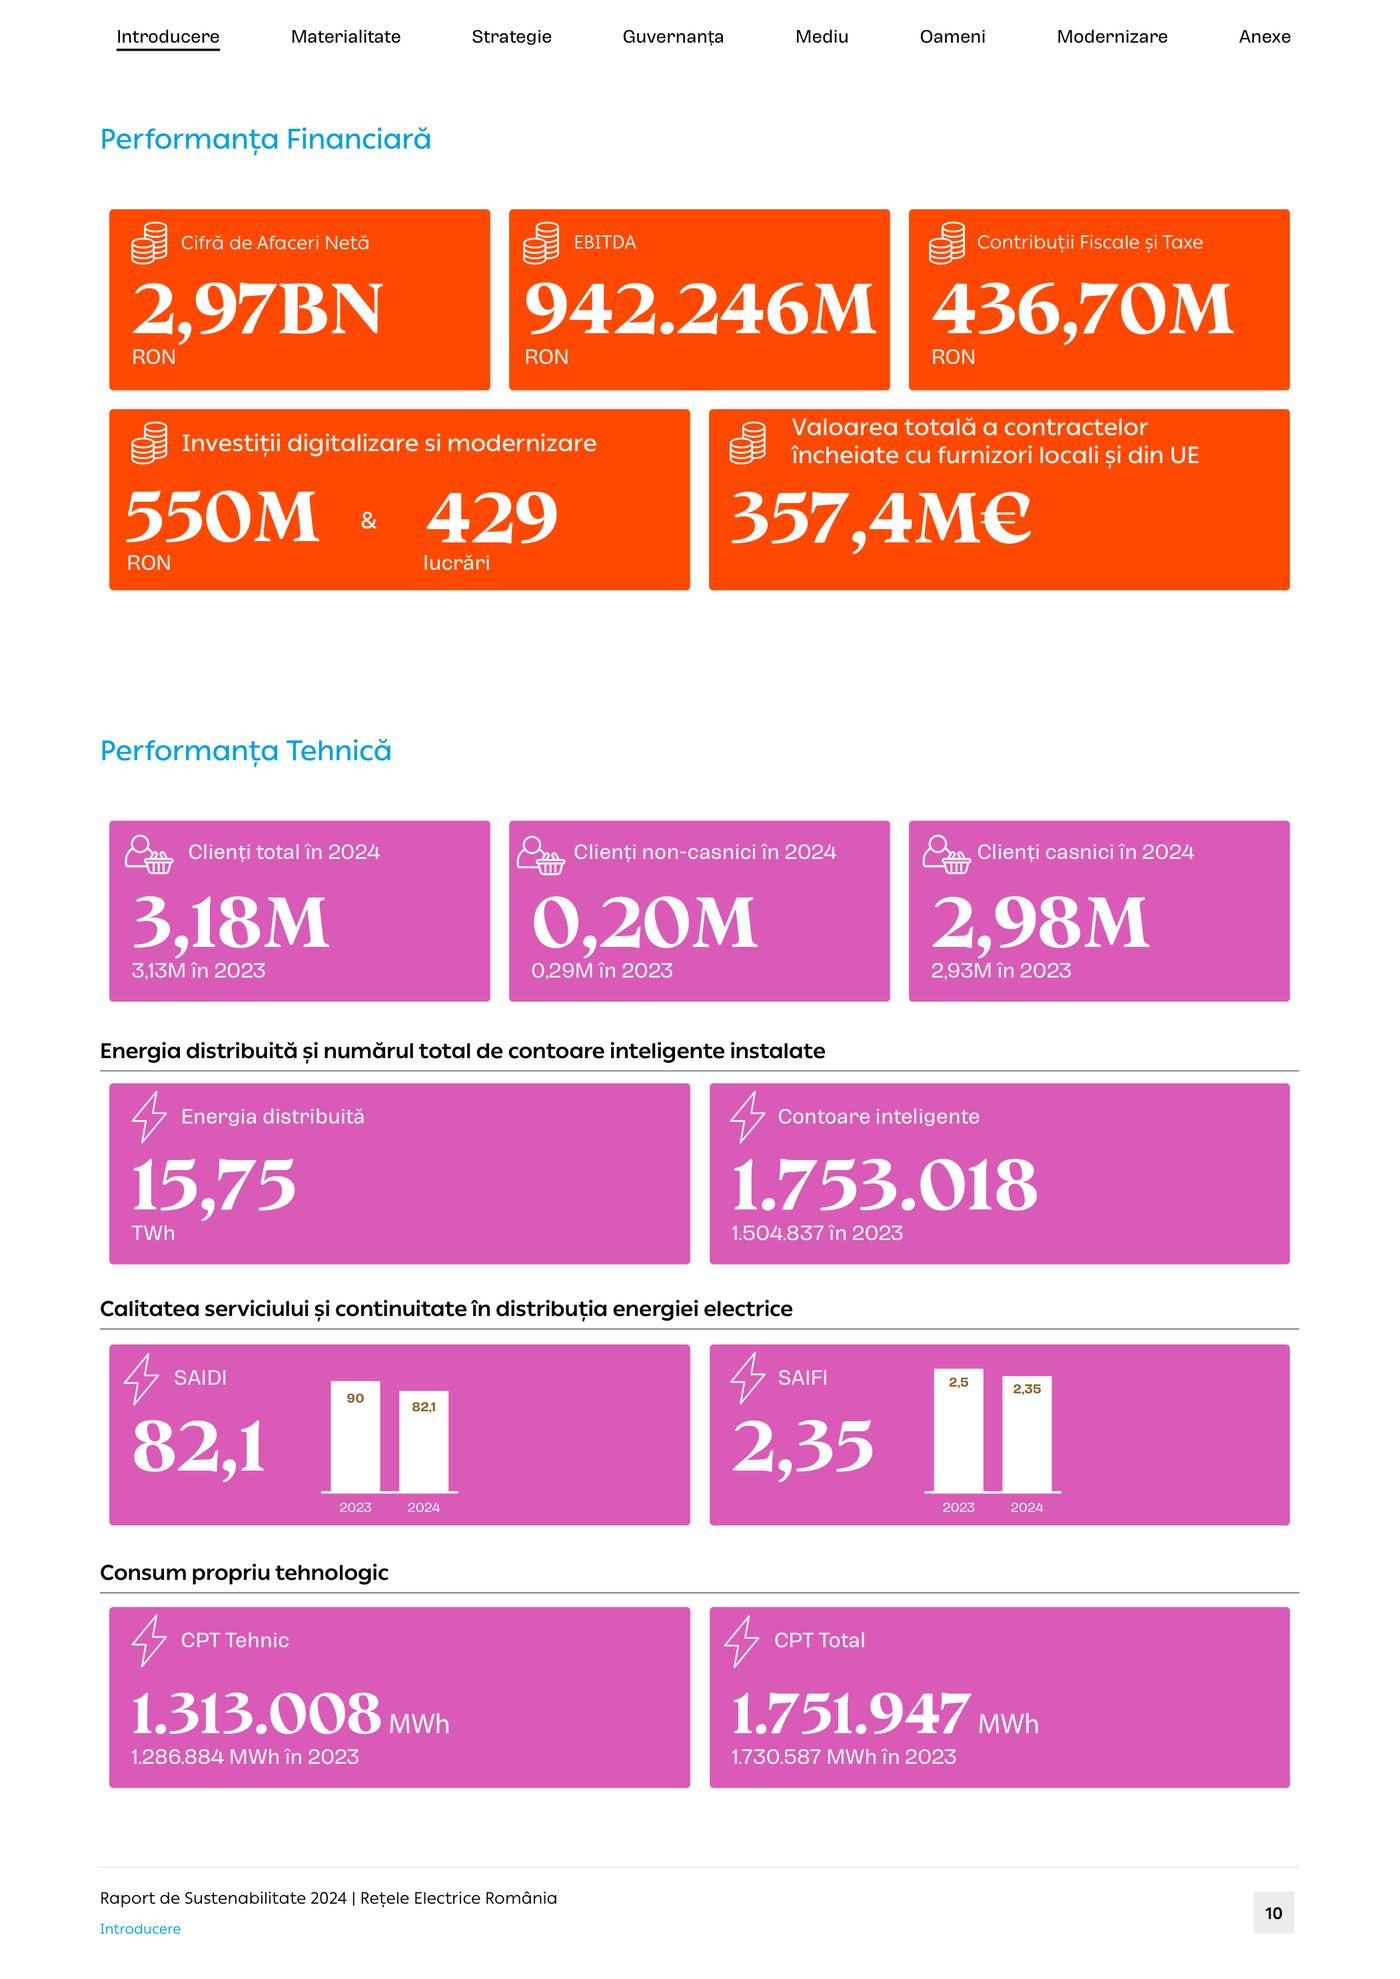
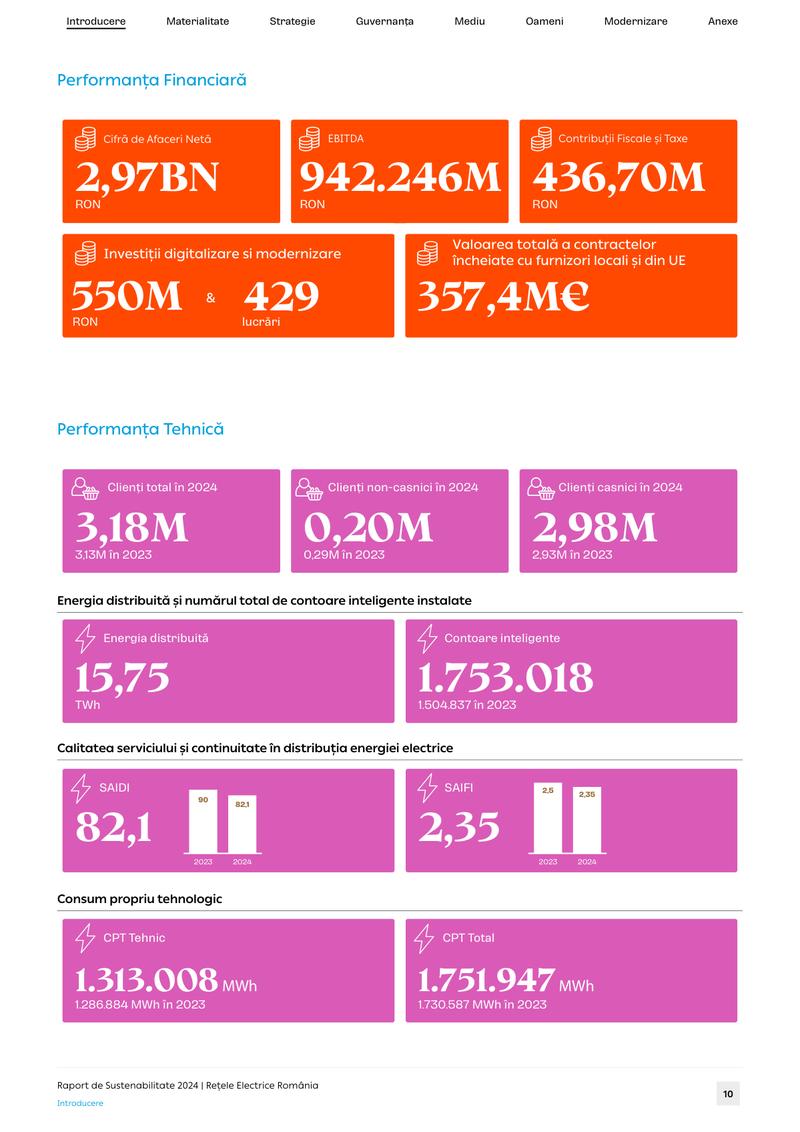
  • Page 10: orange and magenta KPI tiles for financial and technical performance, with small bar charts inside the tiles.
    p. 10The year in KPI tiles
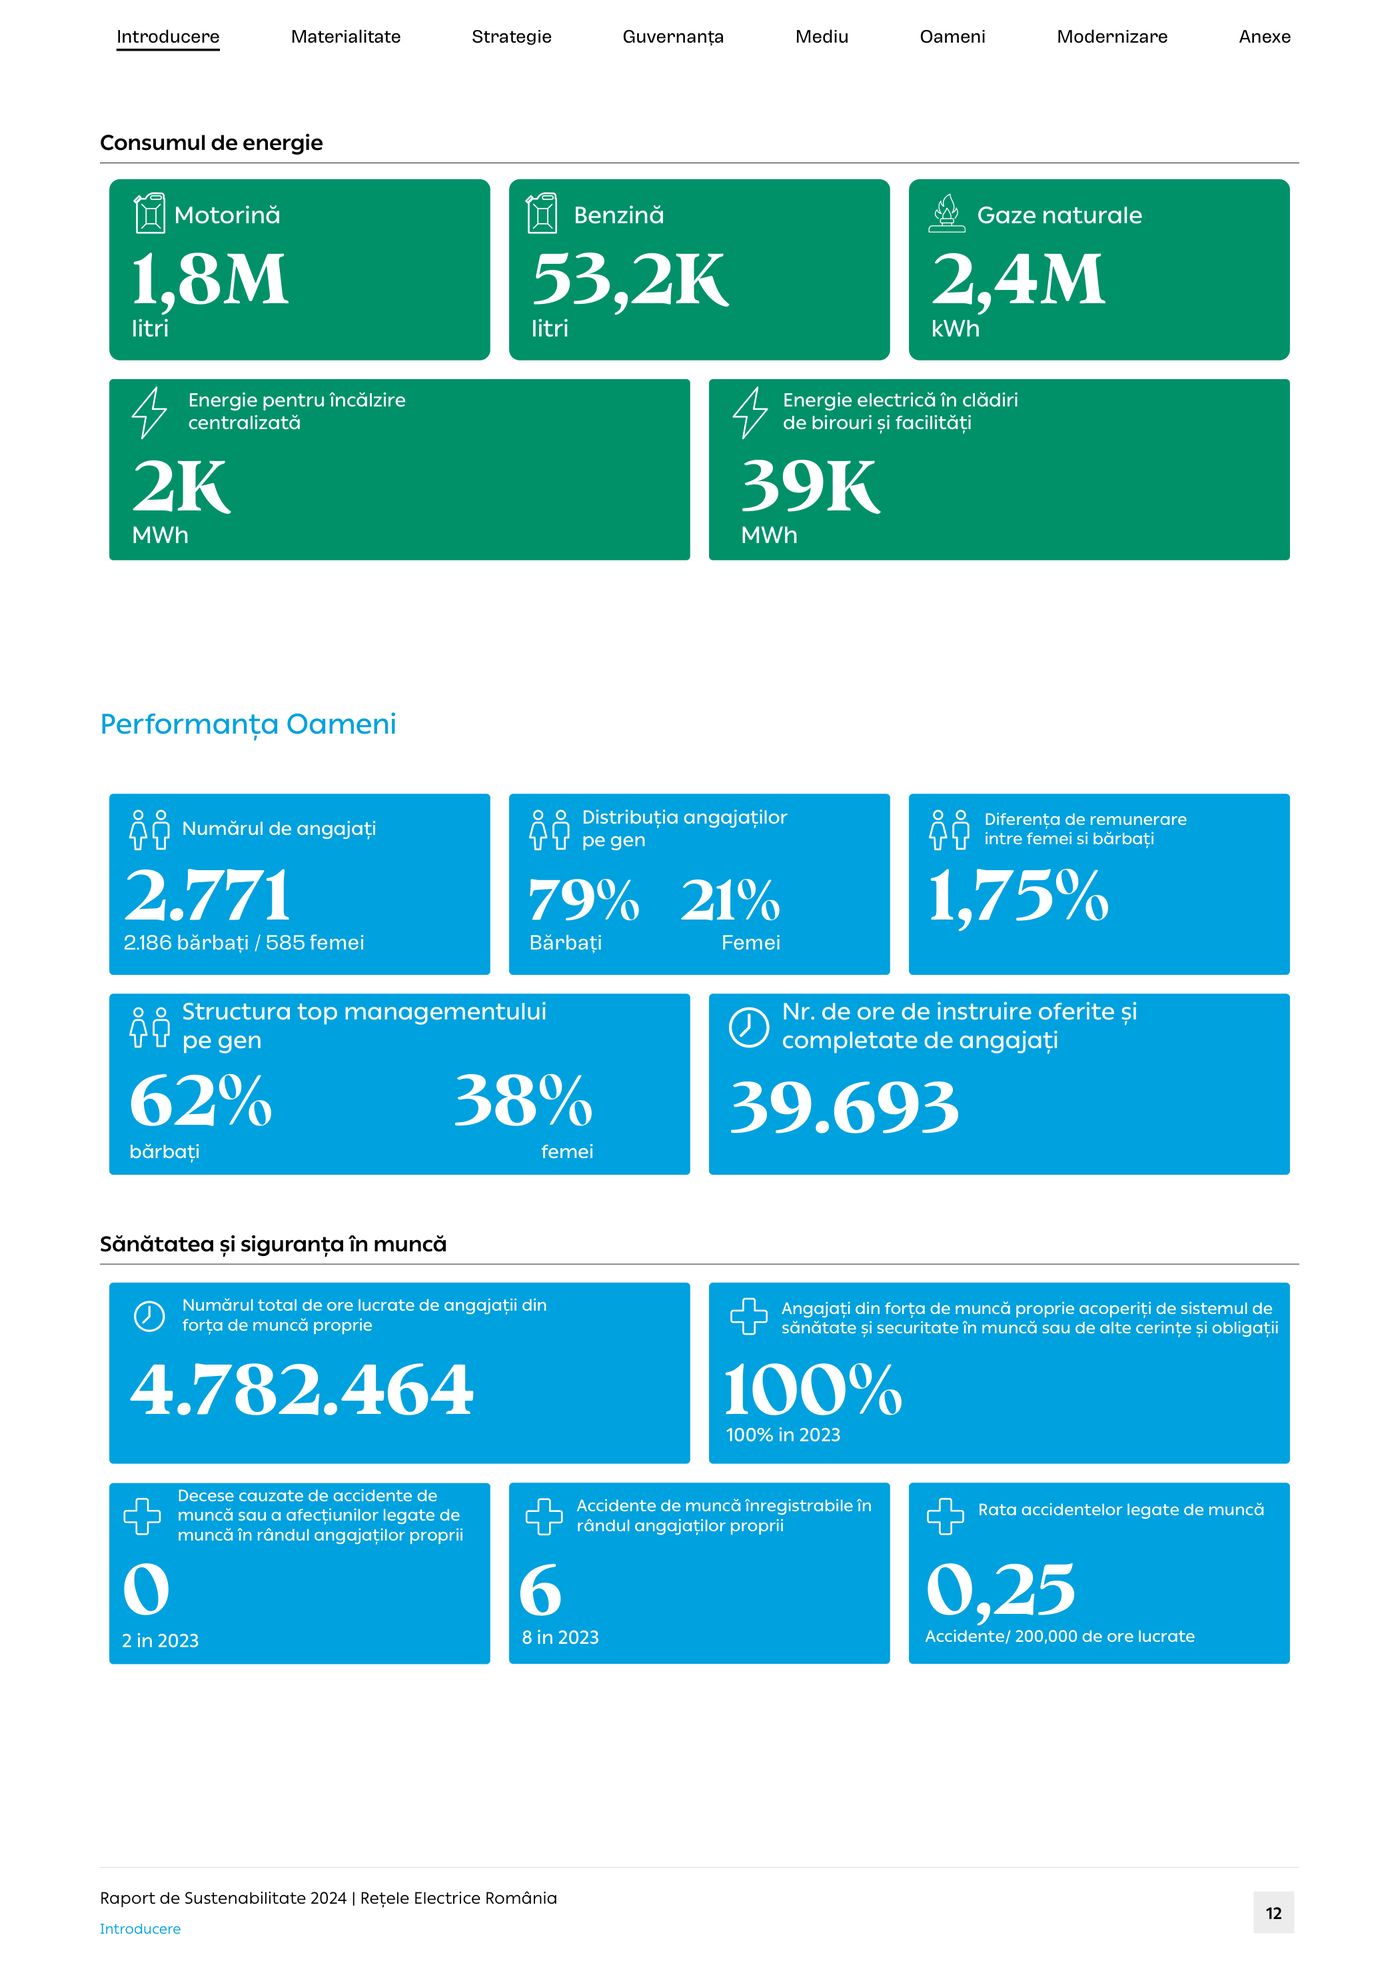
  • Page 12: green and blue KPI tiles for energy consumption, workforce and safety indicators.
    p. 12People and energy at a glance
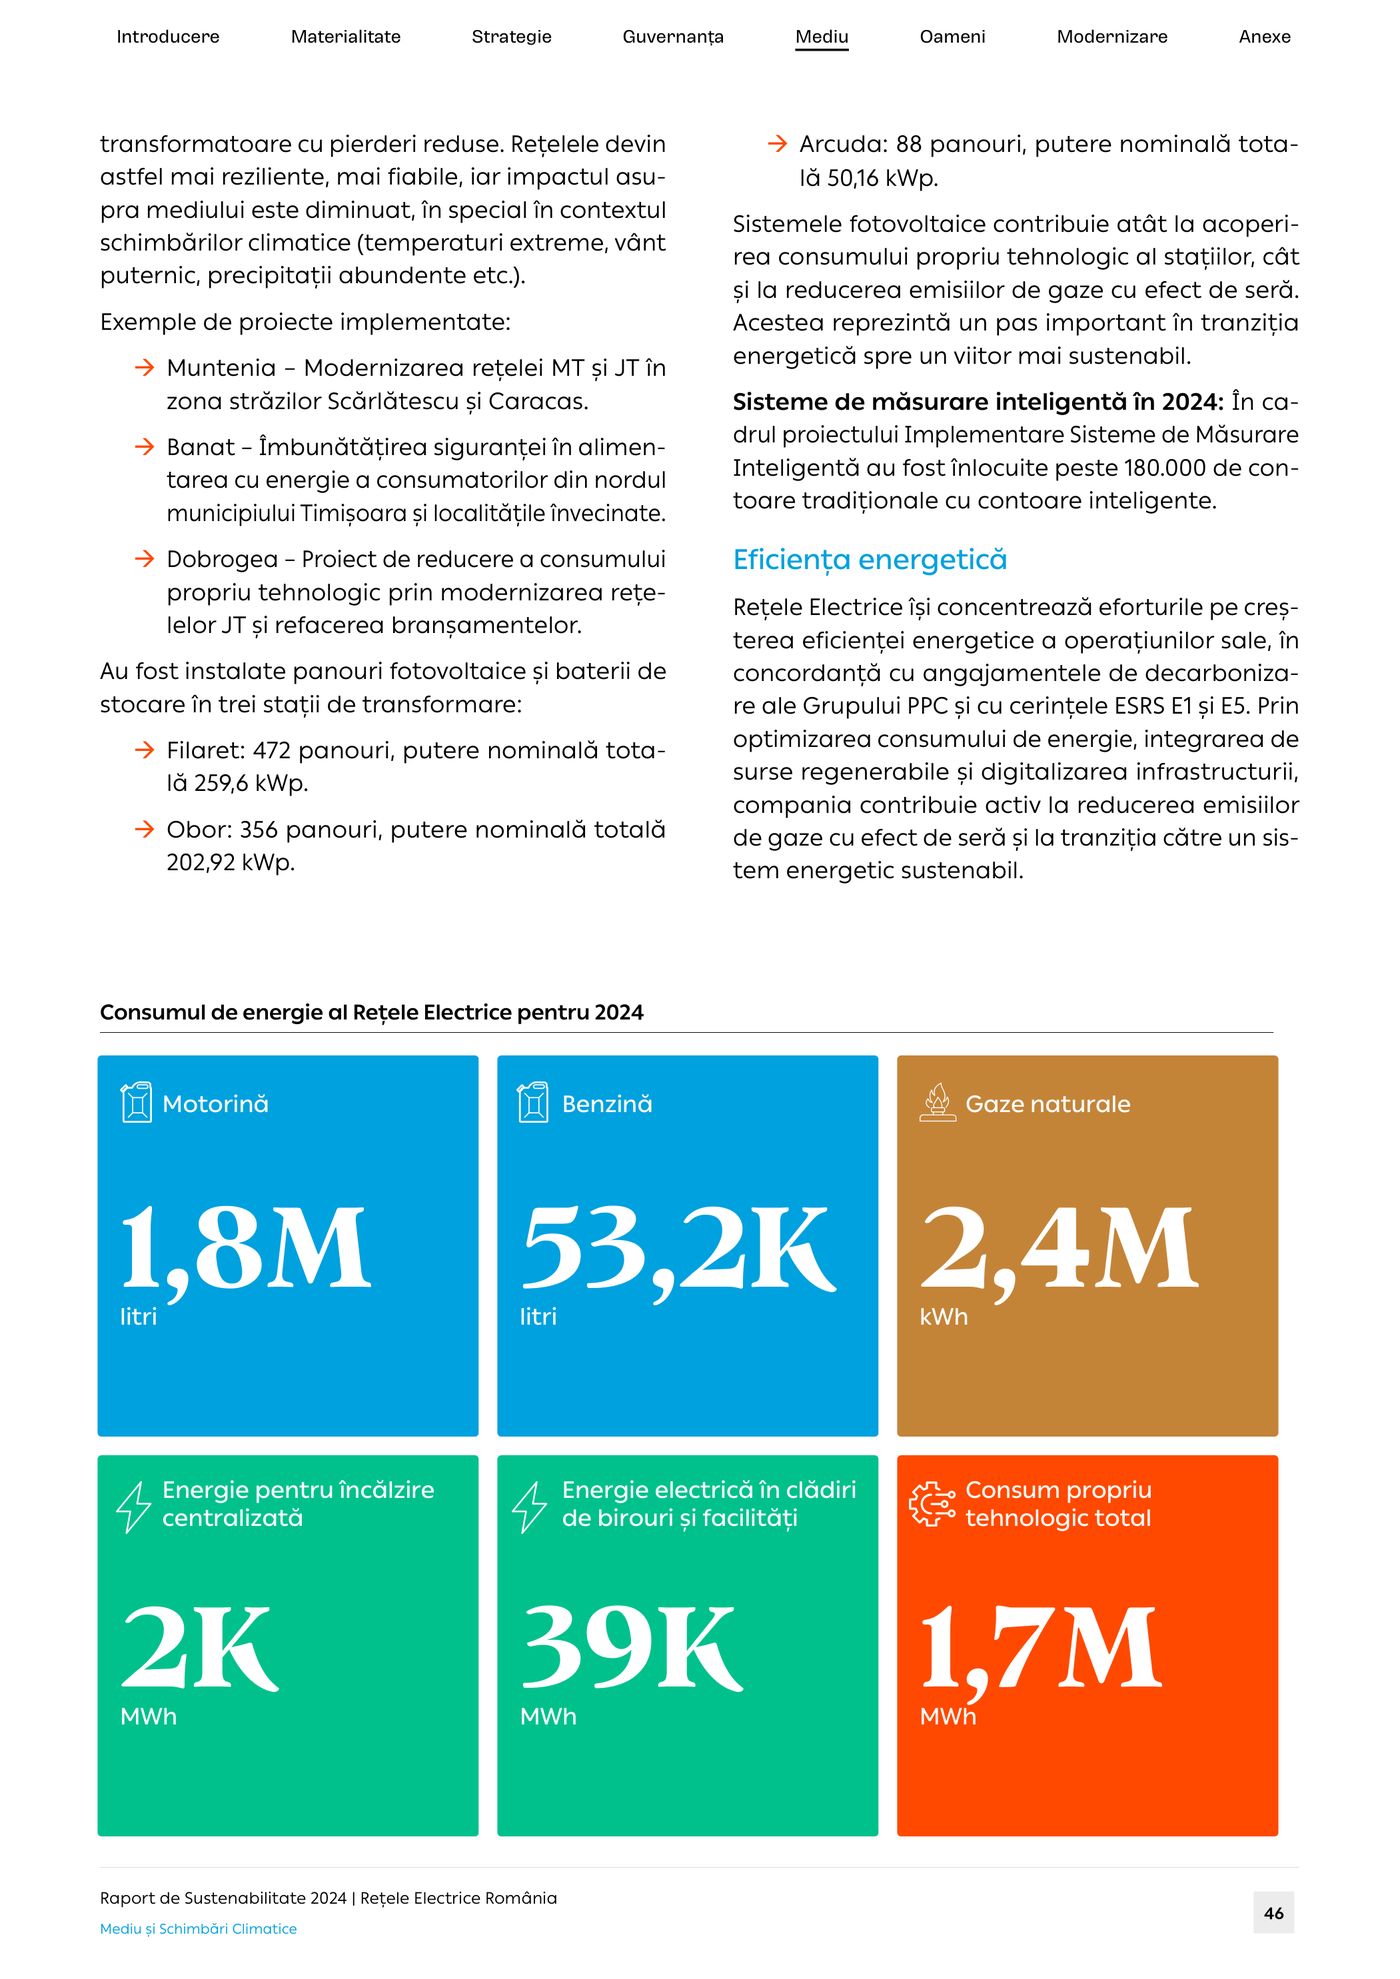
  • Page 46: a grid of large green, ochre and orange tiles for energy consumption by source in 2024.
    p. 46Energy, by source
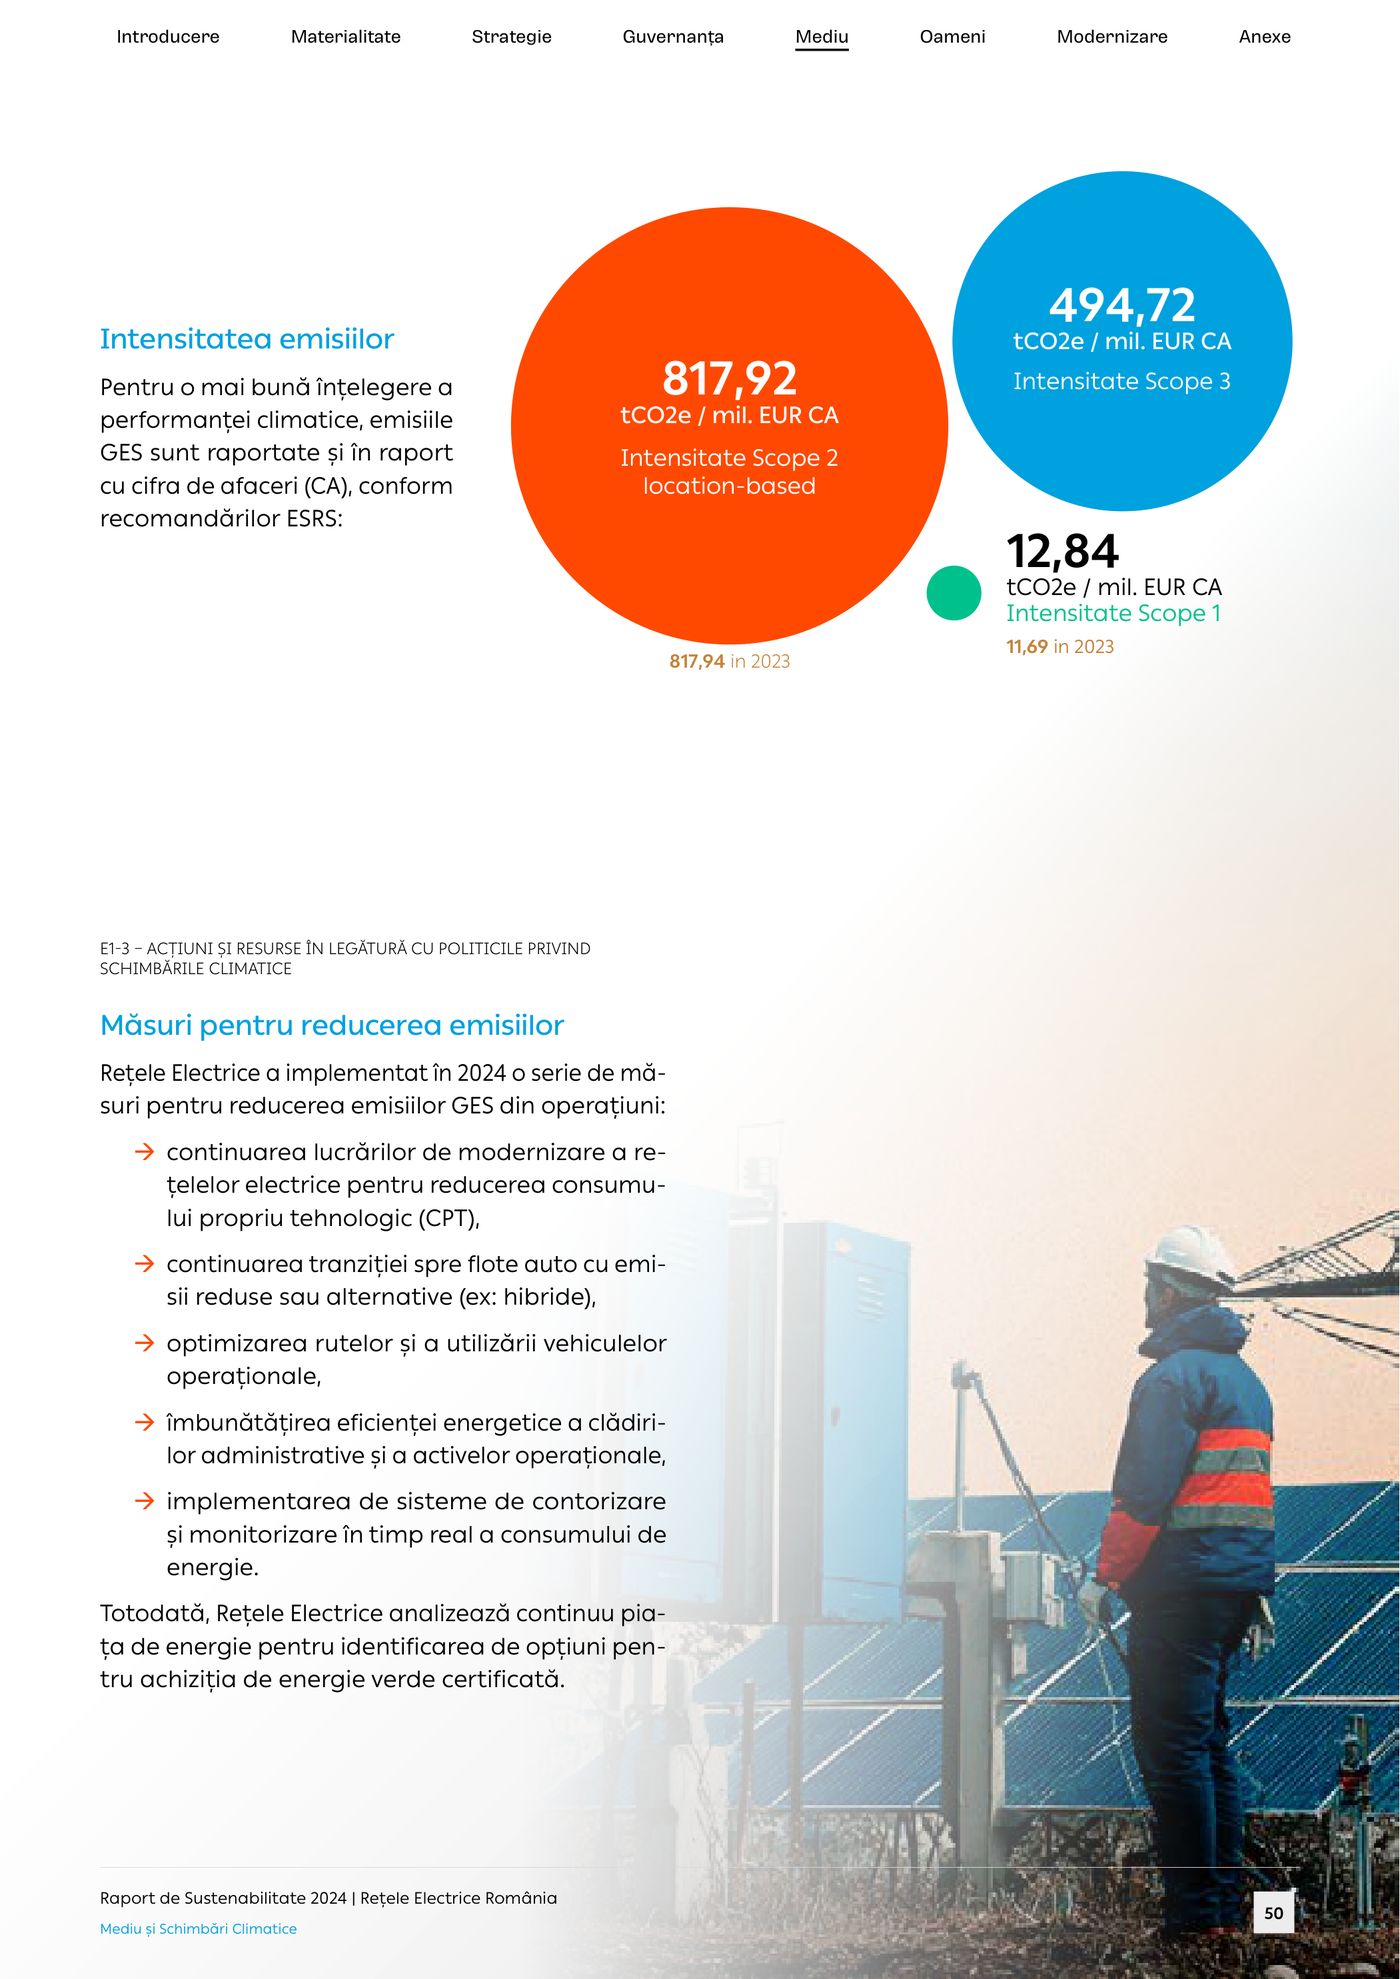
  • Page 50: proportional circles comparing emissions intensity for Scopes 1, 2 and 3 per million euros of turnover.
    p. 50Emissions intensity
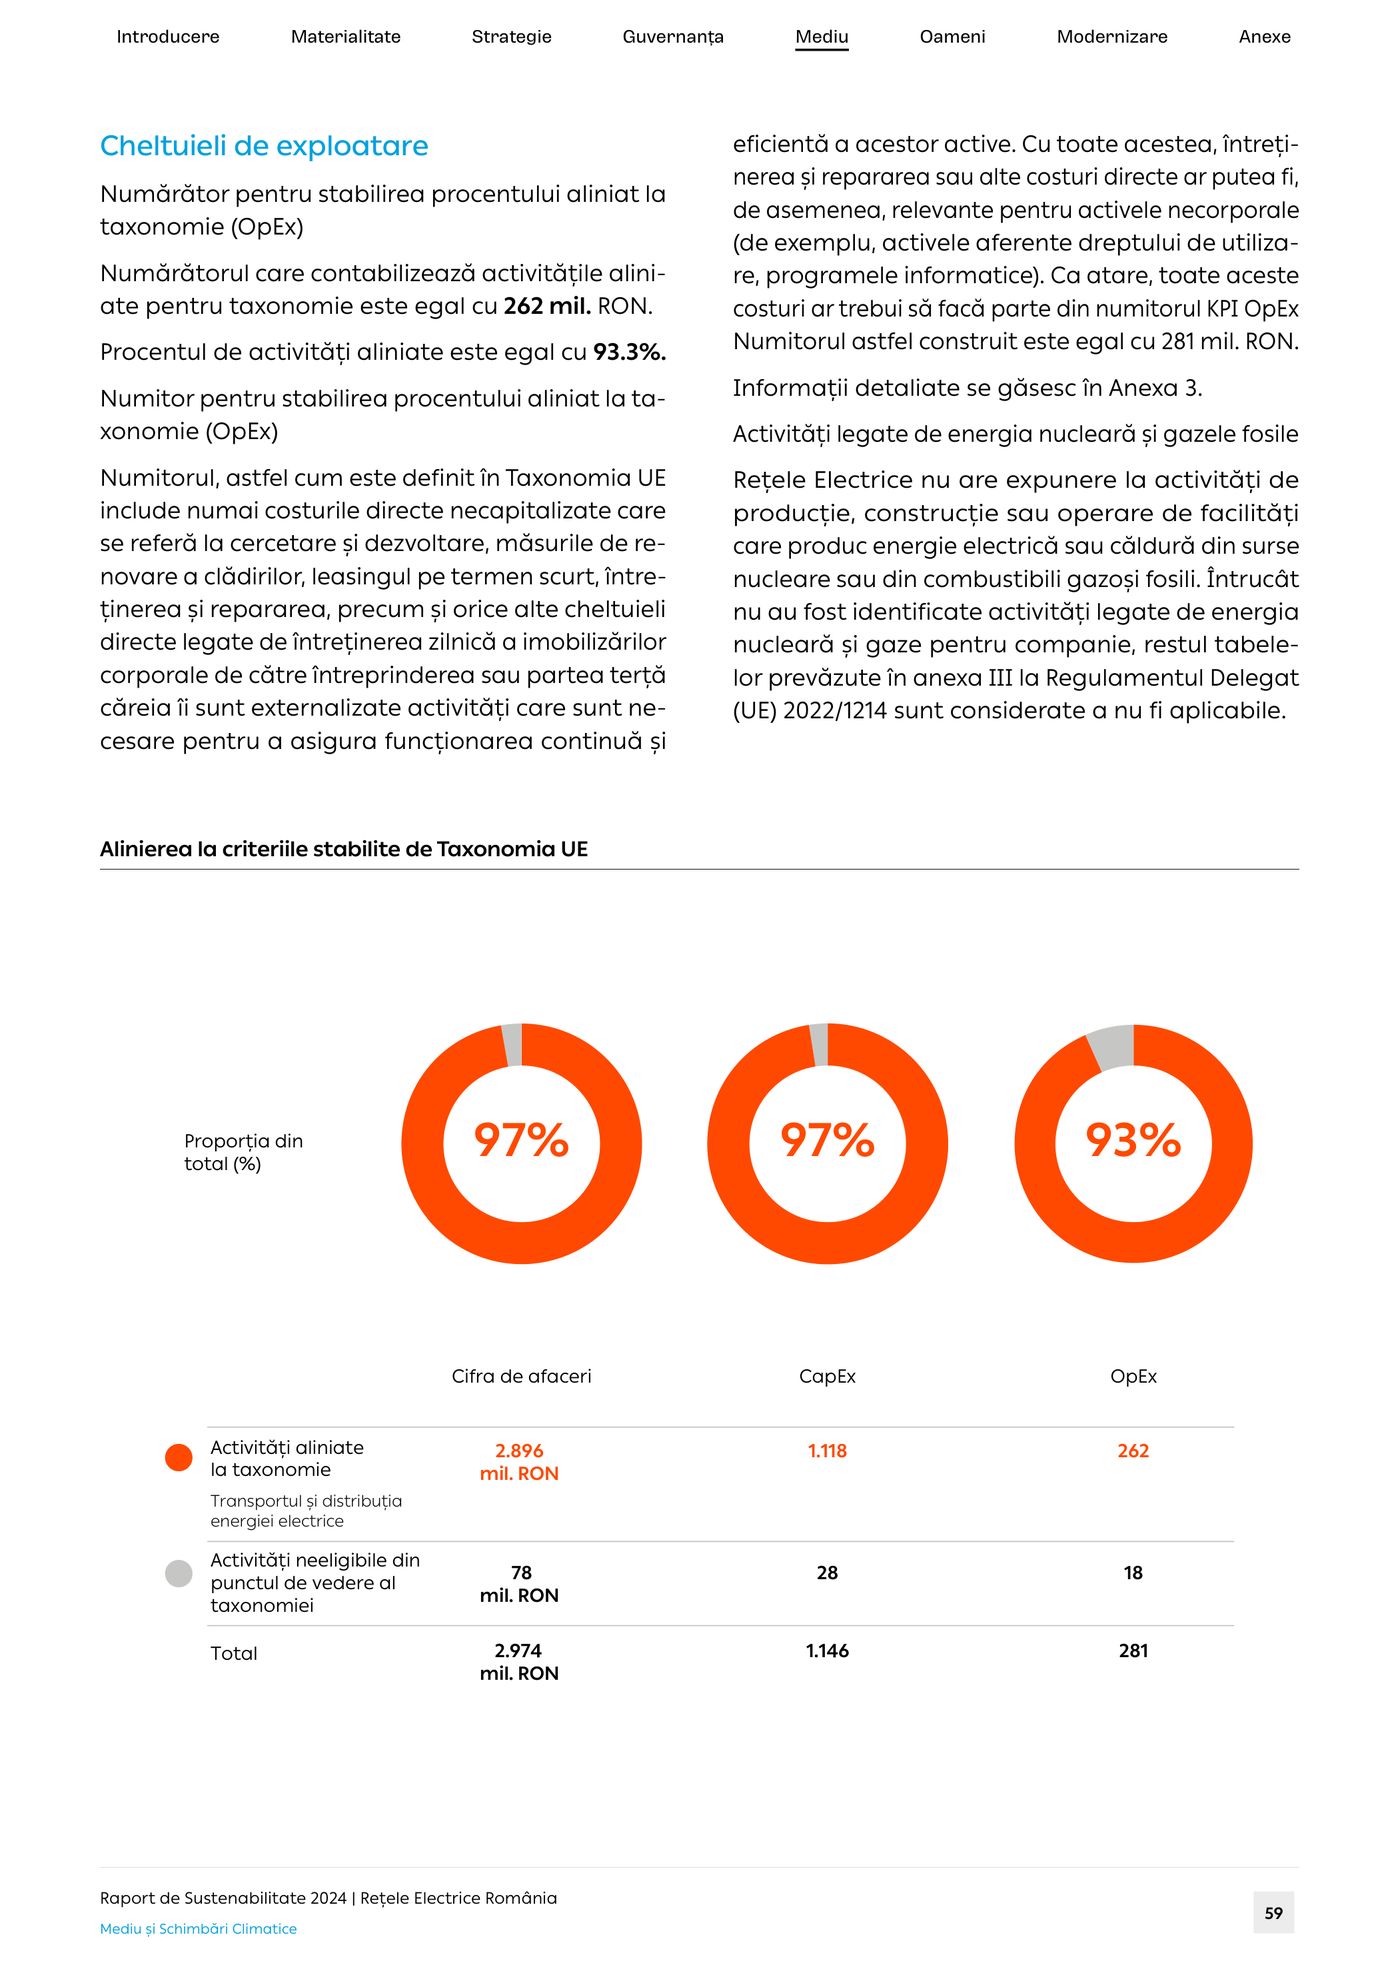
  • Page 59: three orange ring charts showing the share of activities aligned with the EU Taxonomy.
    p. 59EU Taxonomy alignment
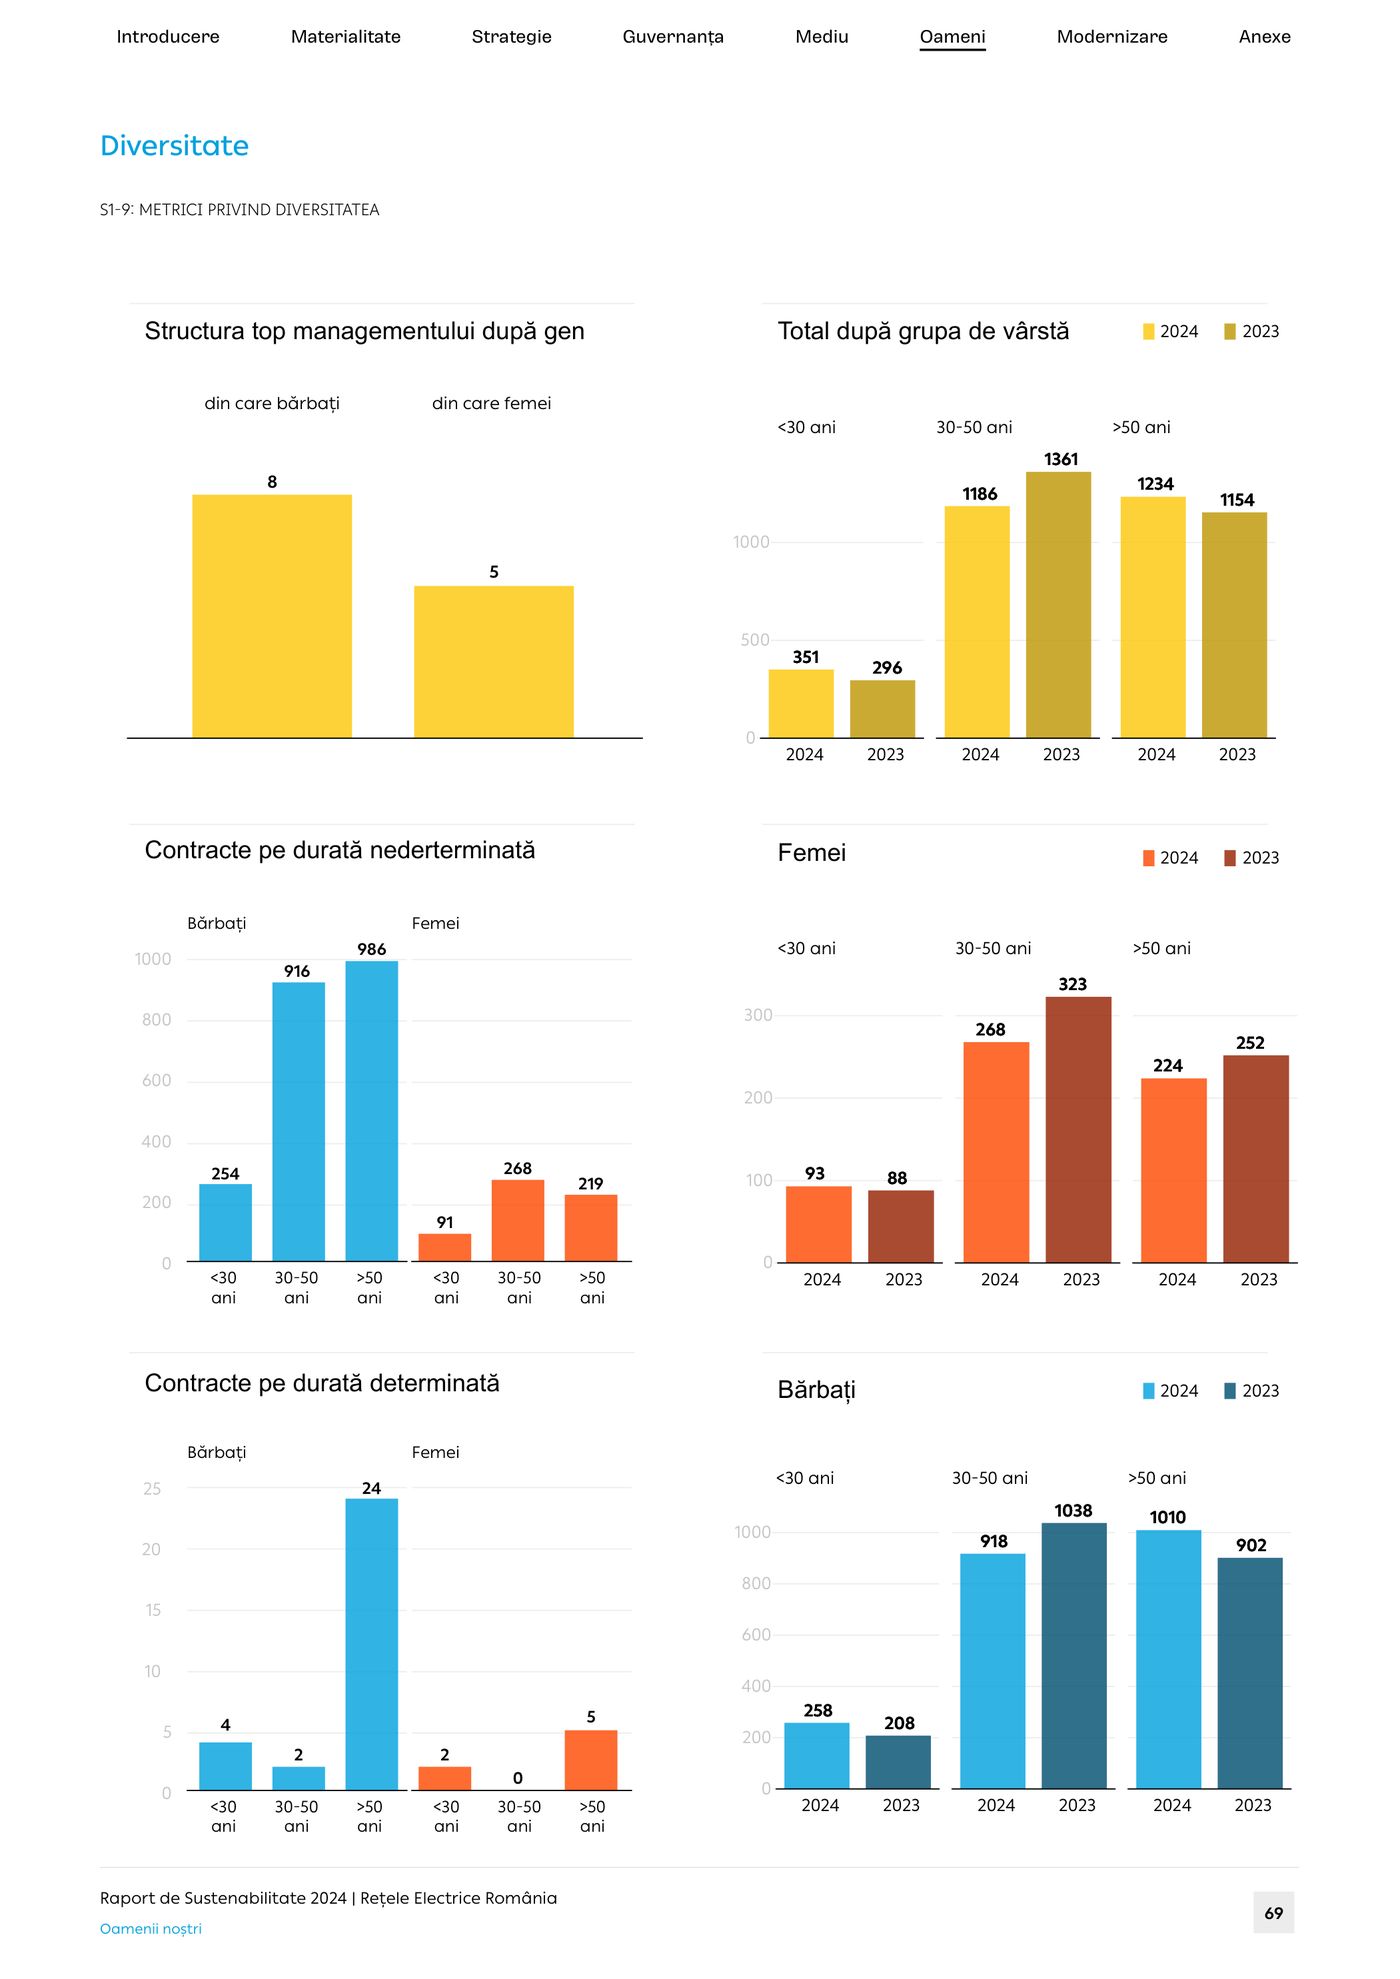
  • Page 69: yellow and blue column charts of the workforce by gender, age and type of contract, 2023 against 2024.
    p. 69Workforce diversity
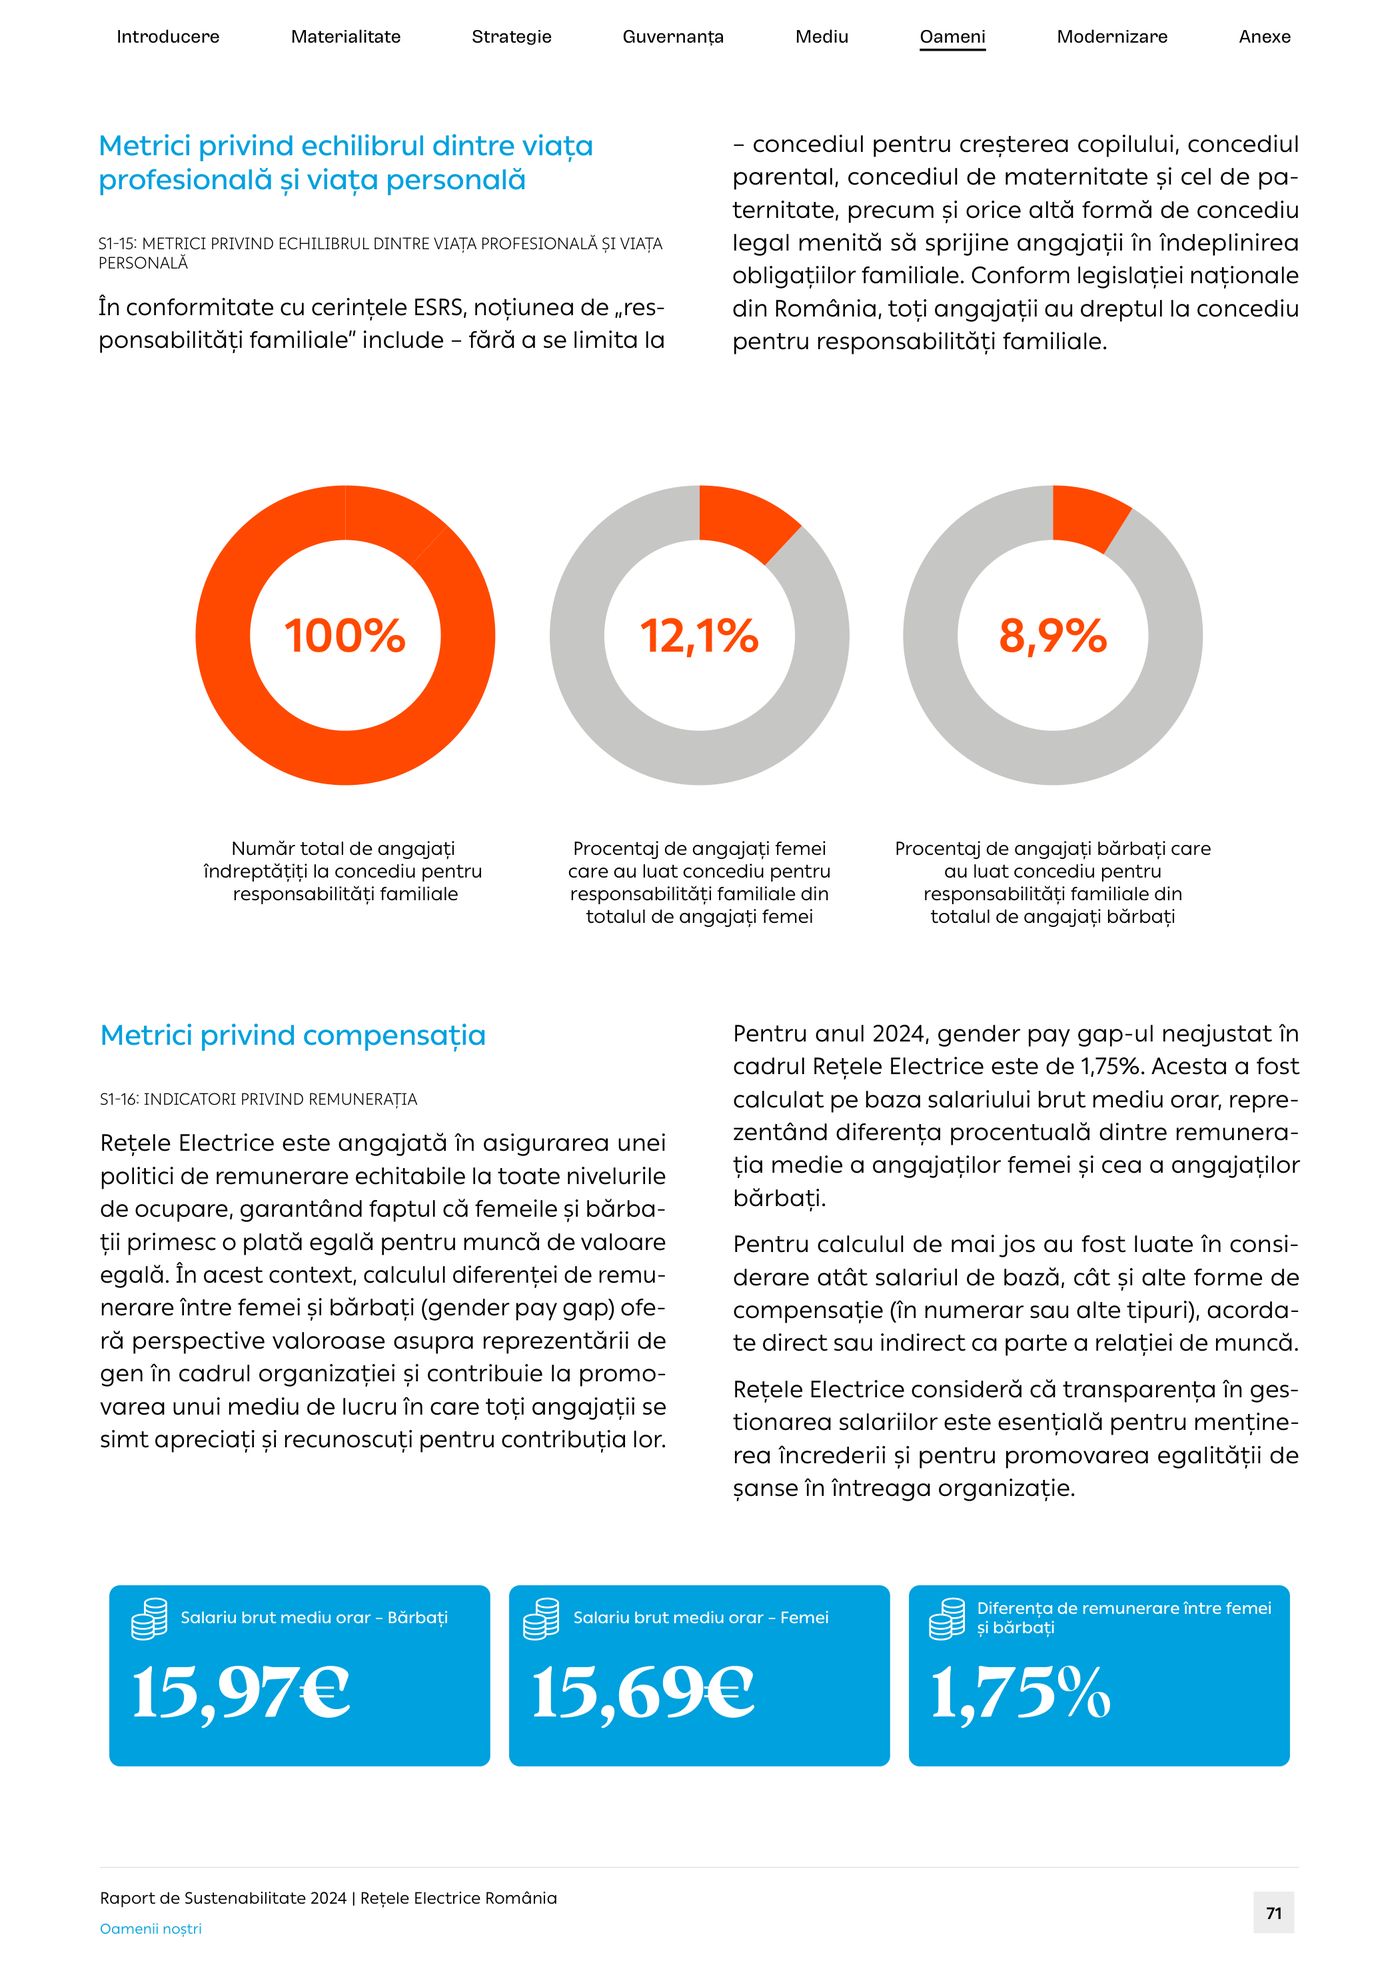
  • Page 71: orange ring charts for family-related leave and blue tiles for pay indicators.
    p. 71Work–life balance and pay
From page to screen

Page 49, off the page.

On paper, page 49 of the Rețele Electrice report traces 793,348 tonnes of CO₂ equivalent from three scopes to eleven sources. On screen, rebuilt from the same numbers, it answers questions. Point at any flow to follow it.

Printed · p. 49
Live Rebuilt from page 49’s data

Gross Scope 1, 2 and 3 emissions and total GHG emissions, 2024 (tCO₂e)

Point at, tap or tab to a scope or a source to follow its flow.

Total, 2024 793,348 tCO₂e Scope 2 is 61.7% of it: almost all network losses.
See the data as a table
Gross emissions by scope and source, tCO₂e. Rețele Electrice România, page 49.
Scope and source20242023Share of 2024
Scope 1 · direct emissions7,6886,9110.97%
Mobile combustion6,255–0.79%
Fugitive gases (SF₆, HFCs)931–0.12%
Stationary combustion502–0.06%
Scope 2 · indirect, from energy489,554483,40361.7%
Network losses (CPT), incl. commercial losses478,282473,22660.3%
Electricity for offices and facilities10,670–1.3%
Other purchased energy590–0.07%
Electricity for vehicles12–<0.01%
Scope 3 · other indirect296,106–37.3%
Purchased goods and services (cat. 1)145,654–18.4%
Capital goods (cat. 2)145,432–18.3%
Fuel- and energy-related activities (cat. 3)2,616–0.33%
Waste generated in operations (cat. 5)2,404–0.30%
Total793,348–100%

Labels translated from the Romanian original. 2023 figures where the page gives them, restated by the client with 2024 emission factors.

Reports into dashboards

PDF in. Dashboard out.

A PDF is a snapshot. We connect a report’s charts to the datasets behind them, so its figures can be filtered, refreshed and explored, by the people you report to and by the people who run the organisation.

Outwards

Show your impact

Data-driven storytelling for funders, partners, the press and the public: shareable charts, country and programme pages, and a number behind every claim.

  • Funders
  • Partners
  • Press
  • Public
Inwards

Decide with data

The same datasets for boards and teams: indicators that refresh as new data arrives, filters by region, year or programme, and the view each decision needs.

  • Boards
  • Management
  • Programme teams
  • Analysts
Live demo · one table, two dashboards

How Africans rate the major powers

% of citizens who say each power’s influence on their country is somewhat or very positive. Table 2 of Beyond borders, page 28, rebuilt as a dashboard.

View

Source: Afrobarometer Round 10 (2024/2025), in Beyond borders (African insights 2026), Table 2. Former colonial power: 37 countries (Liberia has none). Outwards turns the table into a sentence a press release can use; inwards adds the rank and the gap a programme team needs.

How it works

From raw data to final proof.

  1. Data audit

    We start with the data, not the layout: what’s there, what’s missing, and what the numbers can honestly carry.

  2. Chart system

    Palette, type and chart grammar for the whole report, so every figure speaks the same language.

  3. Design and verify

    Every page laid out, every number checked against its source, on screen and again on the proof.

  4. Publish, then extend

    Print-ready PDF and digital edition, social cards for launch day, and a dashboard when you want the data to keep working.

Made for
  • Flagship reports
  • Sustainability & ESG reports
  • Annual reports
  • Survey research
  • Policy briefs
  • Impact reports

Got a report full of numbers? Let’s make it read.

State-of-the-art data design, bespoke craft, every number checked. A brief, a dataset or last year’s PDF is all we need to start.